
MAAS (Metal-as-a-Service) Full HA Installation
This was the process I used for installing MAAS in an HA configuration. Your installation journey may vary, based on configuration choices. This was written to share my experience beyond using MAAS in the single instance Test/POC configuration
Components & Versions
Ubuntu 20.04.4 LTS (Focal Fossa)
Postgres SQL 14.5 (streaming replication)
MAAS 3.2.2 (via snaps)
HA Proxy 2.6.2
Glass 1.0.0
Server Configuration (for reference in configuration settings)
2x Region/API controllers, 2x Rack controllers, 2x General Servers
SV5-SU1-BC2-01 [Primary DB / Region Controller / HA Proxy]
SV5-SU1-BC2-02 [Secondary DB / Region Controller / HA Proxy]
SV5-SU1-BC2-03 [Rack Controller / Glass]
SV5-SU1-BC2-04 [Rack Controller]
SV5-SU1-BC2-05 [General Server]
SV5-SU1-BC2-06 [General Server]
Prerequisites
Servers deployed with Static IPs
Internet Access
limited Linux/Ubuntu experience helpful
VIM editor knowledge (or other Linux text editor)
Primary Postgres SQL Install
First we need to install Postgres SQL. I am using streaming replication to ensure there is a copy of the database. you may select a different method for protecting your database.
# INSTALL PRIMARY POSTGRES SQL
# Run on SV5-SU1-BC2-01 (Primary DB)
sudo apt update && sudo apt upgrade
sudo apt -y install gnupg2 wget vim bat
sudo apt-cache search postgresql | grep postgresql
sudo sh -c 'echo "deb http://apt.postgresql.org/pub/repos/apt $(lsb_release -cs)-pgdg main" > /etc/apt/sources.list.d/pgdg.list'
wget --quiet -O - https://www.postgresql.org/media/keys/ACCC4CF8.asc | sudo apt-key add -
sudo apt -y update
sudo apt -y install postgresql-14
systemctl status postgresql
sudo -u postgres psql -c "SELECT version();"
sudo -u postgres psql -c "SHOW data_directory;"

# CREATE USERS AND DATABASE FOR MAAS
# Run on SV5-SU1-BC2-01 (Primary DB) only

export MAASDB=maasdb
export MAASDBUSER=maas
# WARNING you have to escape special characters for the password
export MAASDBUSERPASSWORD=secret

sudo -u postgres psql -c "CREATE USER \"$MAASDBUSER\" WITH ENCRYPTED PASSWORD '$MAASDBUSERPASSWORD'"
sudo -u postgres createdb -O $MAASDBUSER $MAASDB

# Check user and database via query
sudo -u postgres psql
# List databases
\l
# list users
\du
# drop DB
#DROP DATABASE <DBNAME>;
# quit
\q

# POSTGRESSQL LISTEN ADDRESS
sudo vi /etc/postgresql/14/main/postgresql.conf
# search for listen_addresses ='localhost' uncomment and edit  listen_addresses ='*' save and quit

# ALLOW DATA ACCESS
sudo vi /etc/postgresql/14/main/pg_hba.conf
#add lines
# host    maasdb          maasdbuser      172.30.0.0/16           md5
# host    replication     maasdbrep       172.30.0.0/16           md5

# CHECK LOG FOR ERROR
tail -f /var/log/postgresql/postgresql-14-main.log

# Additional Commands
# PostgresSQL restart Command
# sudo systemctl restart postgresql
# Uninstall PostgresSQL
# sudo apt-get --purge remove postgresql postgresql-*
Configure Postgres SQL Streaming Replication
# INSTALL SECONDARY POSTGRES SQL
# RUN on SV5-SU1-BC2-02 (Secondary DB)
sudo apt update && sudo apt upgrade
sudo apt -y install gnupg2 wget vim bat
sudo apt-cache search postgresql | grep postgresql
sudo sh -c 'echo "deb http://apt.postgresql.org/pub/repos/apt $(lsb_release -cs)-pgdg main" > /etc/apt/sources.list.d/pgdg.list'
wget --quiet -O - https://www.postgresql.org/media/keys/ACCC4CF8.asc | sudo apt-key add -
sudo apt -y update
sudo apt -y install postgresql-14
systemctl status postgresql
sudo -u postgres psql -c "SELECT version();"
sudo -u postgres psql -c "SHOW data_directory;"

# RUN on SV5-SU1-BC2-01 (Primary DB)
# CREATE REPLICATION USER
export MAASREPUSER=maasdbrep
export MAASREPASSWORD=secret
sudo -u postgres psql -c "CREATE USER \"$MAASREPUSER\" WITH REPLICATION ENCRYPTED PASSWORD '$MAASREPASSWORD'"

# CREATE REPLICATION SLOT
# RUN on SV5-SU1-BC2-01 (Primary DB)
sudo -u postgres psql
select * from pg_create_physical_replication_slot('maasdb_repl_slot');
select slot_name, slot_type, active, wal_status from pg_replication_slots;

# CONFIGURE REPLICATION
# RUN on SV5-SU1-BC2-02 (Secondary DB)
sudo systemctl stop postgresql
sudo -u postgres rm -rf /var/lib/postgresql/14/main/*
sudo -u postgres pg_basebackup -D /var/lib/postgresql/14/main/ -h 172.30.9.66 -X stream -c fast -U maasdbrep -W -R -P -v -S maasdb_repl_slot
# enter password for maasdbrep user
sudo systemctl start postgresql

# CHECK LOG FOR ERROR
tail -f /var/log/postgresql/postgresql-14-main.log

# CHECK REPLICATION
# RUN on SV5-SU1-BC2-01 (Primary DB)
sudo -u postgres psql -c "select * from pg_stat_replication;"
MAAS Installation Region Controllers
# All Hosts
sudo snap install --channel=3.2 maas

# INITIATE FIRST CONTROLLER
# Run on SV5-SU1-BC2-01
sudo maas init region --database-uri "postgres://maas:secret@SV5-SU1-BC2-01/maasdb" |& tee mass_initdb_output.txt
## use default MAAS URL, Capture MAAS_URL

# INITIATE SECOND CONTROLLER
# Run on SV5-SU1-BC2-02
sudo maas init region --database-uri "postgres://maas:secret@sv5-su1-bc2-01/maasdb" |& tee mass_initdb_output.txt

# Capture MAAS_SECRET for additional roles
sudo cat /var/snap/maas/common/maas/secret

# CREATE ADMIN
# follow prompts, can import SSH keys via lanuchpad user
sudo maas createadmin
Install Rack Controllers
# INSTALL RACK CONTROLLERS
# run on SV5-SU1-BC2-03 & SV5-SU1-BC2-04
sudo maas init rack --maas-url $MAAS_URL --secret $MAAS_SECRET

# CHECK MAAS SERVICES
sudo maas status

# CONFIGURE SECONDARY API IP ADDRESS
sudo vi /var/snap/maas/current/rackd.conf

# Update contents of file to include both API URLs
maas_url:
   - http://172.30.9.66:5240/MAAS
   - http://172.30.9.57:5240/MAAS
Install HA Proxy for Region / API Controllers
# INSTALL HAPROXY BINARIES
# run on SV5-SU1-BC2-01 and SV5-SU1-BC2-02
sudo add-apt-repository ppa:vbernat/haproxy-2.6 --yes
sudo apt update
sudo apt-cache policy haproxy
sudo apt install haproxy -y
sudo systemctl restart haproxy
sudo systemctl status haproxy
haproxy -v

# CONFIGURE HA PROXY
sudo vi /etc/haproxy/haproxy.cfg
# update this content
        timeout connect 90000
        timeout client  90000
        timeout server  90000
# insert this content at the end of the file
frontend maas
    bind    *:80
    retries 3
    option  redispatch
    option  http-server-close
    default_backend maas

backend maas
    timeout server 90s
    balance source
    hash-type consistent
    server maas-api-1 172.30.9.66:5240 check
    server maas-api-2 172.30.9.57:5240 check

sudo systemctl restart haproxy
Add A Host records to DNS

Browse MAAS via DNS name
Enable VLAN DHCP
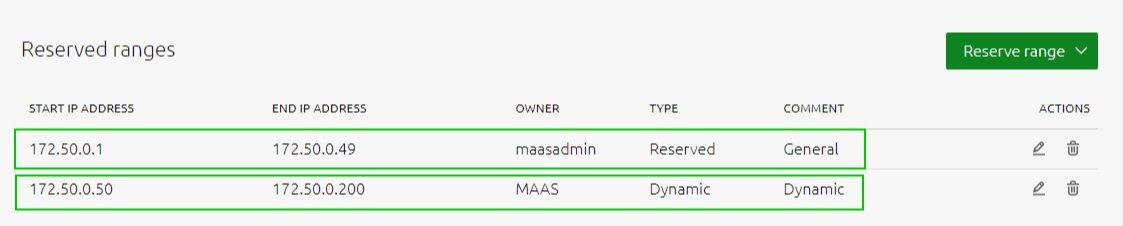
First going to Subnets to look for the secondary network

You need to add at least a dynamic range. You may6 want to include a general reserved range
Now we can add the DHCP server to the Fabric, select the VLAN containing your subnet

Provide DHCP, you can now select primary and secondary rack controllers and click configure DHCP

Commission the First Server
Find a server you can PXE boot to test DHCP configuration

As long as the server can communicate on the network, you will see the it grab an IP address from the dynamic range we specified
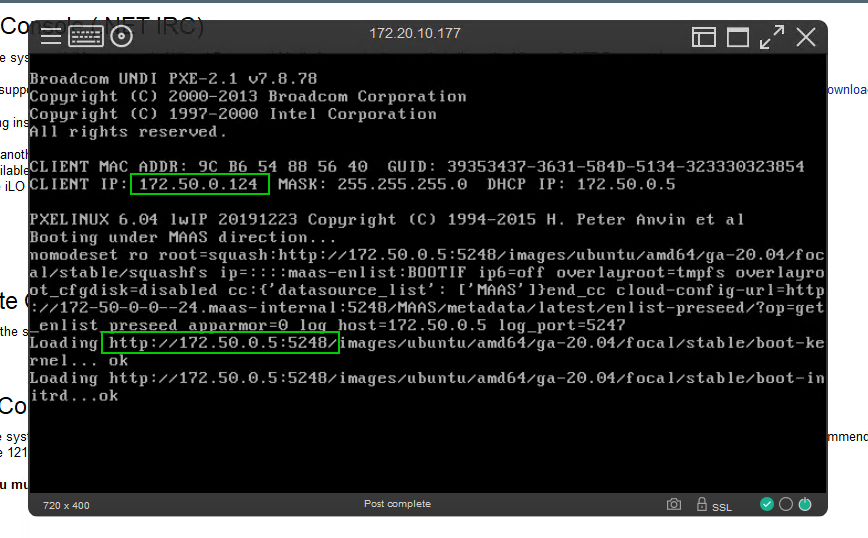
the ubuntu image will be loaded and Maas will start enlisting the server into its database

back in the console we can see the server has been given a random name and is commissioning

The server has been enlisted and is now listed as ‘New’
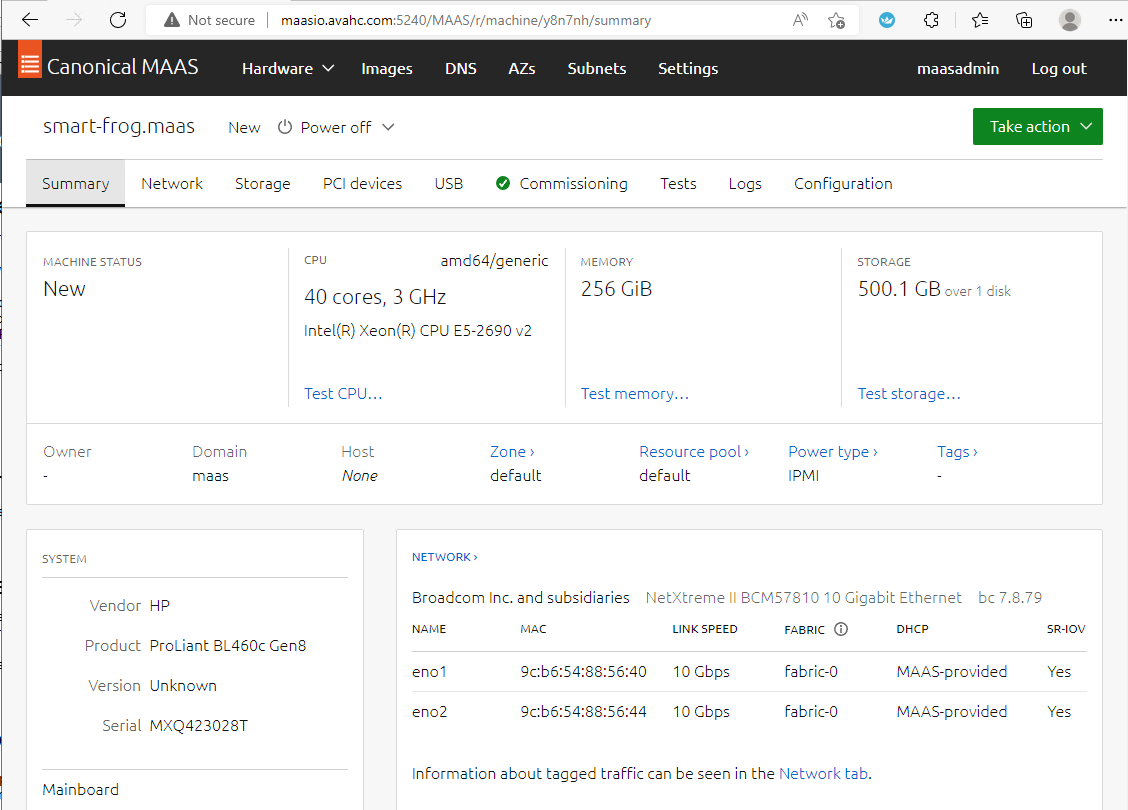
We can commission the server to bring it under Maas Control

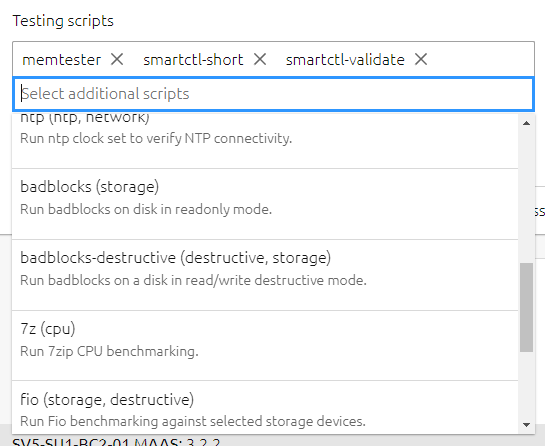
there are additional options you can select and other tests you can execute, see Maas.io for more information

You can test your hardware, Disks, memory, and CPU for potential issues
you can edit the servers name and check out the commissioning, tests, and logs sections while the servers is being comissioned
Eventually, you will see the server status as ready. We have a new name for this server and we can see the ‘Commissioning’ and ‘Tests’ were all successful.
here are two commissioned servers in MAAS ‘Ready’ for deployment in this test environment
for a larger example I can show you in our lab environment we have 195 servers under Maas’s control with 48 dynamic tags to help organize and manage our hardware
Creating Server Tags
It can be easier to organize servers by using tags based on hardware types. Let’s create 3 tags, to identify the hardware vendor, server model, and CPU model.
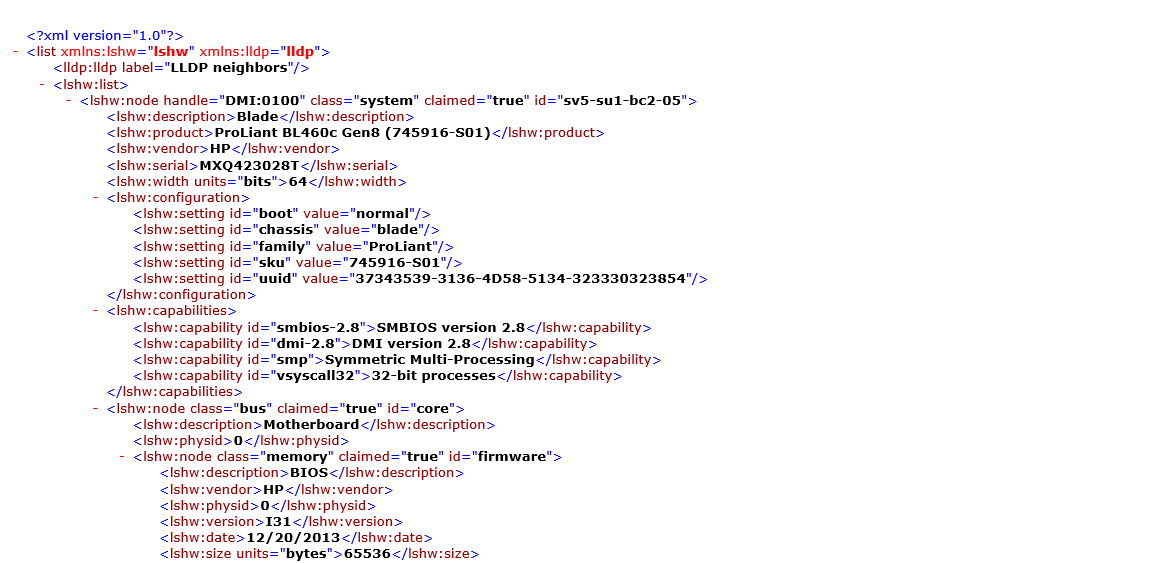
Select ‘Logs’ and ‘Download’ and select ‘Machine Output (XML) to download XML server file

here you can browse through the file so you can find the content you need to create your regex match. You will need to understand how to create regex search. There are examples and websites that can help with this.
Return to ‘Machines’ and select ‘Tags’

select ‘Create New Tag’
//node[@class="system"]/product = "ProLiant BL460c Gen8 (745916-S01)"//node[@class="system"]/vendor = "HP"//node[@id="cpu:0"]/product = "Intel(R) Xeon(R) CPU E5-2690 v2 @ 3.00GHz"you can view the dynamic tags associated with your first commissioned server

Deploying Images
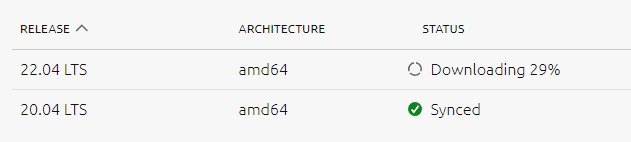
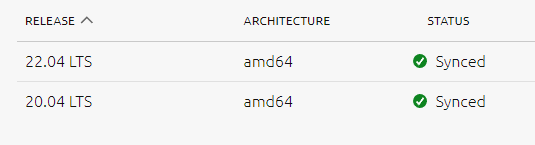
first lets download an additional ubuntu image the latest LTS image 22.04
The image will download and sync with the rack controllers
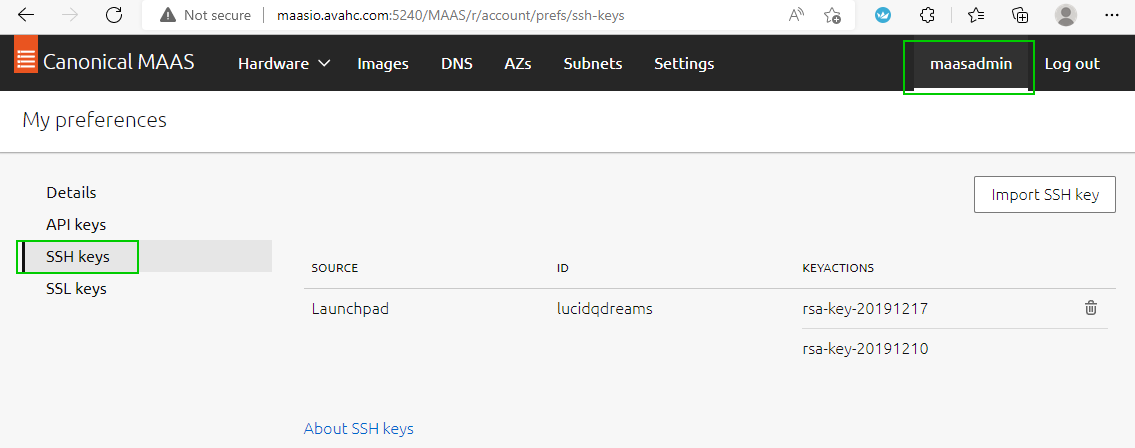
before deploying this image let’s make sure we have an SSH key imported. I have created these using PuTTYgen. I will not cover creating or uploading these keys here, see existing documentation. In the Lab environment, it includes my administration key and a common key shared with other admins.
Select ‘Machines’, select ‘Ready

we can no
DHCP Long Lease
You may want to consider extending the DHCP lease time for subnets by using snippets. We are using DHCP for OOB management and extending the lease time brings additional continuity to network devices while attempting to reduce configuration complexity
Add Listen Statistics to HA Proxy
# CONFIGURE HA PROXY
sudo vi /etc/haproxy/haproxy.cfg
# insert this content at the end of the file
listen stats
        bind localhost:81
        stats enable                    # enable statistics reports
        stats hide-version              # Hide the version of HAProxy
        stats refresh 30s               # HAProxy refresh time
        stats show-node                 # Shows the hostname of the node
        stats uri /                # Statistics URL

sudo systemctl restart haproxy
Browse to common DNS address and statistics port
Install Glass (DHCP Monitoring)
# INSTALL GLASS
sudo apt-get install -y nodejs
nodejs -v

cd /opt
sudo git clone https://github.com/Akkadius/glass-isc-dhcp.git
cd glass-isc-dhcp
sudo mkdir logs
sudo chmod u+x ./bin/ -R
sudo chmod u+x *.sh

sudo apt install npm -y

sudo npm install
sudo npm install forever -g
sudo npm start

# CONFIGURE GLASS
sudo vi /opt/glass-isc-dhcp/config/glass_config.json

"leases_file": "/var/snap/maas/common/maas/dhcp/dhcpd.leases",
"log_file": "/var/snap/maas/common/log/dhcpd.log",
"config_file": "/var/snap/maas/common/maas/dhcpd.conf",

# START GLASS
sudo npm start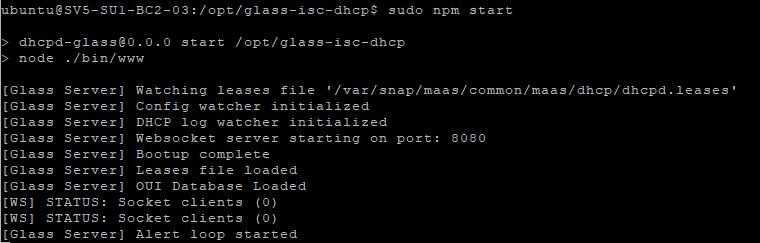
browse to the name or IP of the server on port 3000 and you can see the interface.

this content from the main Lab system with more data

you can use this interface to search for data such as mac address or IP address and look at start and end lease data
There are more details about how to configure this solution in the GitHub project itself
Access command line API
Sometimes you just want to get data from the command line. Maas has a number of operations it can do from the command line. It this example we are going to retrieve the MAAS user password for the iLO
you will need to get your API key, found under your username and ‘API Keys’ select copy
SSH into one of your MAAS hosts run the command
maas login <username> <apiurl> <apikey>
the maas.io documentation contains more information about API commands MAAS | API. Running maas <username> will show you the commands
let’s see what the machine operation can do
there is a power-parameters operator and the machine operation requires a system_id. To keep this example simple we are going to grab the machine code from the browser but you could get this information from the command line
if we put all this together we can now run a command and extract the iLO password from the MAAS database via the API on the commandline
Troubleshooting IPMI - IPMI tools
MAAS does a pretty amazing job of grabbing any hardware, controlling the iLO/BMC/Drac/OOB management port and creating a user for it to boot and control the server hardware. If you browse to your machine and select configuration you can see the power configuration section.

This contains the settings MAAS is using to control that hardware.
On the rare occasion, you run into trouble, firstly make sure your firmware is up to date. I installed IPMI tools which can be helpful for testing or troubleshooting IPMI operations manually. We can use the details collected in the previous step to execute the query
# INSTALL IPMPTOOL
# Run on SV5-SU1-BC2-03 and SV5-SU1-BC2-04 where IPMI operations take place
sudo apt install ipmitool -y

ipmitool -I lanplus -H 172.20.10.177 -U maas -P 8in0zOE1Lxx -L OPERATOR power status
Running PowerShell Query on API output
And now a favorite topic of mine… PowerShell. Now imagine you could control MAAS through your very own PowerShell queries… I know right?!?
# INSTALL POWERSHELL
# Update the list of packages
sudo apt-get update
# Install pre-requisite packages.
sudo apt-get install -y wget apt-transport-https software-properties-common
# Download the Microsoft repository GPG keys
wget -q "https://packages.microsoft.com/config/ubuntu/$(lsb_release -rs)/packages-microsoft-prod.deb"
# Register the Microsoft repository GPG keys
sudo dpkg -i packages-microsoft-prod.deb
# Update the list of packages after we added packages.microsoft.com
sudo apt-get update
# Install PowerShell
sudo apt-get install -y powershell
# Start PowerShell
pwsh

# SIMPLE EXAMPLE QUERY
maas maasadmin machines read | convertfrom-json
maas maasadmin machines read | convertfrom-json | select resource_uri
What else is possible? Let’s say you have blade chassis and through the power of centralized management, you PXE boot all blades at once. MAAS will register hundreds of hosts.
Do you want to match the serial number of the blade slot to the chassis number?
Thanks, but that would be a hard no from me
how about some PowerShell?
Absolutely!
# SCRIPT TO SET MACHINE NAME
# Find the serial number of each Chassis and define prefix
$scaleunit = @{ '8Z35xxx' = 'SV5-SU3-BC1';'8Z56xxx' = 'SV5-SU3-BC2';'11N7xxx' = 'SV5-SU3-BC3';'G7S6xxx' = 'SV5-SU3-BC4';'DBR6xxx' = 'SV5-SU3-BC5'}

# Read machines into a variable
$machines = maas maasadmin machines read | ConvertFrom-Json

# process variables and set hostname
foreach ($machine in $machines){
    $chassis = ($machine.hardware_info.chassis_type)
    #Grab info for M1000e blades
    if ($chassis -eq "Multi-system chassis") {
        # Find blade slot
        $slot = ($machine.hardware_info.mainboard_serial).split(".")[3]
        $chassisid = ($machine.hardware_info.chassis_serial)
        $suname = $scaleunit.$chassisid
        $newname = "$suname-$slot"
        write-host $newname
        if ($newname -ne $machine.hostname) {
            maas maasadmin machine update $machine.system_id hostname=$newname
        }
    }
    else {}
}
This is just one example of how you can leverage MAAS data. You could use it to update your CMBD. In this screenshot below, we are using Sunbirds DC track to manage hardware and have created a custom field that is dynamically created and will link you directly to MAAS to find that specific server.
There is a lot you can do to integrate MAAS into your environment to reduce the burden of managing old hardware.
Additional reference documentation
Associate a WAF policy with an existing Application Gateway - using Azure CLI
I recently had to associate a WAF policy that I had created to an existing Application Gateway that has another WAF policy assigned. The official documentation shows this is possible, and gives an example using PowerShell. I wanted to do the same, but with Azure CLI. I couldn’t find any examples when searching the Web, so here’s what I put together, for anyone else needing to do the same (examples are using Linux):
Obtain the Id of the WAF Policy you want to assign to the App Gateway
Update the configuration on the Application Gateway:
export WAF_POL_ID=$(az network application-gateway waf-policy show -g <WAF Resource Group> --name <WAF policy name> --query id -o tsv)
2. Update the configuration on the Application Gateway:
az network application-gateway update --resource-group <App Gateway RG Name> --name <App Gateway Name> --set firewallPolicy.id=$WAF_POL_ID
That’s it!
Here’s an example code snippet you can use in your scripts:
export APPGW_RG="<app gw rg>"
export WAF_RG="<waf policy rg>"
export WAF_POL_NAME="<waf policy name>"

export APPGW_NAME=$(az network application-gateway list -g ${APPGW_RG} --query [].name -o tsv)

export WAF_POL_ID=$(az network application-gateway waf-policy show -g ${WAF_RG}  --name ${WAF_POL_NAME}  --query id -o tsv)

# update the firewall policy assigned to the WAF
az network application-gateway update --resource-group $APPGW_RG --name $APPGW_NAME --set firewallPolicy.id=$WAF_POL_IDTerraform and WSL2 issue
Here’s a quick note on an issue that I encountered today (plus it seems, many other people).
I went to run a Terraform workflow on my system via WSL2, but I cam across a number of problems.
First, was that I couldn’t obtain the State that was stored in an Azure Storage account container. Previously, I used the following config:
backend "azurerm" {
    resource_group_name  = ""
    storage_account_name = ""
    container_name       = "terraform-backend"
    key                  = ""
 }
At runtime, I would specify the values like the example below.
export TF_CLI_ARGS_init="-backend-config=\"storage_account_name=${TERRAFORM_STATE_CONTAINER_NAME}\" -backend-config=\"resource_group_name=${RESOURCE_GROUP_NAME}\" -backend-config=\"access_key=${STG_KEY}\""However, today, that didn’t work as it just stalled trying to connect to the storage container.
I thought it was something wrong with my credentials, so for troubleshooting purposes, I added the storage account key to see if that made a difference
backend "azurerm" {
    resource_group_name  = ""
    storage_account_name = ""
    container_name       = "terraform-backend"
    key                  = ""
    access_key           = ""
}
I added the primary storage key and lo and behold, this time, it worked.
Strange, as I hadn’t updated the terraform cli or providers.
The next problem I saw was that when I tried to run
terraform planit would not complete, seemingly freezing. To troubleshoot this, I ran
export TF_LOG="TRACE"before running the plan to tell me what was happening in the background.
This in turn produces a verbose output, but something that did catch my was this:
Strange. I know I have internet connectivity and I could certainly connect to Azure using az cli, so I did some Goole-fu and found the following: https://github.com/microsoft/WSL/issues/8022
It was exactly the same problem I had encountered.
Applying the fix https://github.com/microsoft/WSL/issues/5420#issuecomment-646479747 worked for me and persisted beyond a reboot.
(run the code below in your WSL2 instance)
sudo rm /etc/resolv.conf
sudo bash -c 'echo "nameserver 8.8.8.8" > /etc/resolv.conf'
sudo bash -c 'echo "[network]" > /etc/wsl.conf'
sudo bash -c 'echo "generateResolvConf = false" >> /etc/wsl.conf'
sudo chattr +i /etc/resolv.conf
It appears to have occurred in the latest Windows update and affects WSL2. It only appears to affect Go / Terraform as far as I can tell.
Hopefully this will help anyone having a similar issue until the Go provider is fixed.

Fixing Azure Firewall Monitor Workbook
TLDR; Here’s a version of The Azure Firewall Workbook that I fixed: https://github.com/dmc-tech/az-workbooks :)
For a client project, I had to deploy an Azure Firewall and I want to ease the monitoring burden, so I deployed the Azure Monitor workbook as per the article here.
The article has a link to a Workbook that can be deployed to your Azure subscription, and is a great resource giving you plenty of insight into what activity has been taking place on the firewall, via a Log Analytics Workspace configured as part of the diagnostics settings for the resource.
However, I did notice that some of the queries didn’t work as expected and produced some interesting results for the Application rule log statistics.
Below is an example:
If you check out the Action column, you can see that it has quite a lot of information, where I would expect to see ‘Allow’ or ‘Deny’.
I also noticed that some of the other panes did not return any results (such as above), when I expected to see data, so I dug a little deeper, having not really had experience of editing Workbooks.
First of all, I had to check the underlying query, so had to go into ‘edit’ mode.
Once in edit mode, I selected one of the panels that was affected by the faulty query (anything concerning ‘Allow’ for Application Log. Click on the ‘Edit’ button.
We’re concerned with checking the logic and parsing the log, so that the Action is correctly represented, plus the Policy and Rule Collection are populated.
To help triage. I opened the query in the Logs view.
I’ve highlighted where the issues were. First, the logic was incorrect, so the query above was matched, and that did not parse the msg_s field correctly. Second, the parse missed out the ‘space’ for Policy and Rule Collection Group, so would capture incorrectly.

Here’s how the query should look:
Add and msg_s !has “Rule Collection Group as indicated; remove the highlighted and msgs_s !has “Rule Collection , and add spaces as indicated to the parse statement correctly attributes the values to the parameter.
You can see in the query results that the Allow entries no longer have the additional Policy:… text added.
Now that we’ve identify the issue, we need to update the Workbook.
Go back to the workbook end edit the query, putting the identified fixes in place.
Remember to click ‘Done Editing’ when you’re finished.
Here’s a snippet of the query:
(
materializedData
| where msg_s !has "Web Category:" and  msg_s !has ". Url" and msg_s !has  "TLS extension was missing" and msg_s !has "No rule matched" and msg_s !has "Rule Collection Group"
| parse msg_s with Protocol " request from " SourceIP ":" SourcePort " to " FQDN ":" DestinationPort ". Action: " Action ". Rule Collection: " RuleCollection ". Rule: " Rule
),
(
materializedData
| where msg_s !has "Web Category:" and  msg_s !has ". Url" and msg_s !has " Reason: "
| where msg_s has "Rule Collection Group"
| parse msg_s with Protocol " request from " SourceIP ":" SourcePort " to " FQDN ":" DestinationPort ". Action: " Action ". Policy: " Policy ". Rule Collection Group: " RuleCollectionGroup ". Rule Collection: " RuleCollection ". Rule: " Rule
)
Great, we’ve fixed one panel, unfortunately there are more. I’ve shown the process I used to fix the queries, so you can go on and find the the other panels with the same issues and fix yourself, or just go ahead and import a fixed version of the workbook that I uploaded :)
https://github.com/dmc-tech/az-workbooks
Configuring Azure Application Gateway for accessing Kibana
Here’s a quick post on how to configure Azure Application Gateway for any instance of Kibana that is being protected will work.
Background:
I’m working with a private OpenShift cluster deployed to Azure (not ARO, it was deployed via IPI), that I want to publish to the public, but protected via the App GW WAF.
Once the cluster had been deployed and is published via the App Gateway, when trying to access Kibana, an internal 500 error was displayed. If accessing directly from within the virtual network, it worked fine, so I know it’s definitely the App Gateway causing the issue.
Looking at the Kibana logs, I saw the following:

Although I obfuscated my Public IP address, you’ll notice that the port is appended, could this be the problem? (of course the answer is yes, IP address:port isn’t a valid IP address!)
The error message kind of gives the clue:
"message": "Cannot resolve address x.x.x.x:50735: [security_exception] Cannot resolve address x.x.x.x:50735"I needed to figure out how to rewrite the request header so it would work
(I won’t talk about how I setup backend address pools, http settings, frontend ports, listeners and probes, as that will be part of future in-depth post on how to do it, but I will describe a particular rewrite rule required so that Kibana works.)
X-Forwarded-For Rewrite Rule
The offending header is X-Forwarded-For . This is added by the Application Gateway which includes the IP + port. Microsoft describe this here.
From the portal, open up your Application Gateway and open up Rewrites

Add a Rewrite set

Give your rule a name that is something meaningful, or just go with the defaults.

Click on the Click to configure this action link (1) and enter the settings below. Once configured, don’t forget to Update the rewrite set.

Once the rewrite rule was in place, Kibana opened as expected.
Topic Search
Posts by Date
- August 2025 1
- March 2025 1
- February 2025 1
- October 2024 1
- August 2024 1
- July 2024 1
- October 2023 1
- September 2023 1
- August 2023 3
- July 2023 1
- June 2023 2
- May 2023 1
- February 2023 3
- January 2023 1
- December 2022 1
- November 2022 3
- October 2022 7
- September 2022 2
- August 2022 4
- July 2022 1
- February 2022 2
- January 2022 1
- October 2021 1
- June 2021 2
- February 2021 1
- December 2020 2
- November 2020 2
- October 2020 1
- September 2020 1
- August 2020 1
- June 2020 1
- May 2020 2
- March 2020 1
- January 2020 2
- December 2019 2
- November 2019 1
- October 2019 7
- June 2019 2
- March 2019 2
- February 2019 1
- December 2018 3
- November 2018 1
- October 2018 4
- September 2018 6
- August 2018 1
- June 2018 1
- April 2018 2
- March 2018 1
- February 2018 3
- January 2018 2
- August 2017 5
- June 2017 2
- May 2017 3
- March 2017 4
- February 2017 4
- December 2016 1
- November 2016 3
- October 2016 3
- September 2016 5
- August 2016 11
- July 2016 13