
Hands on with GitHub Actions and Azure Stack Hub
The past few months, I’ve been working with GitHub Actions as the CI/CD platform for Azure hosted applications. Whilst that wasn’t using Azure Stack Hub, I wanted to see how I could use Actions within my environment, as I really like the low entry barrier, and GitHub is fairly ubiquitous.
From a high level, in order to achieve the integration, we need to use an Action Runner, which in simple terms is an agent running on a VM (or container) that polls for workflow action events and executes those actions on the Action runner system where the agent resides. GitHub can provide containerized runners out-of-the-box, and that’s great if you’re using a public cloud, but in the vast majority of cases, Azure Stack Hub is in a corporate network, so we can use a self-hosted runner for these scenarios, and that’s what I’ll be using here.
There are already some tutorials and videos on how you can integrate into your Azure Stack Hub environment, but I wanted to go a little deeper, from showing and explaining how to get your environment setup, to automating the creation of a self-hosted runner in your Azure Stack Hub tenant.
First, here are some links to some great content:
https://channel9.msdn.com/Shows/DevOps-Lab/GitHub-Actions-on-Azure-Stack-Hub
and the official docs:
As ever, the documentation assumes you are familiar with the platform. I won’t, so will go through step-by-step what you need to do and hopefully be successful first time!
Pre-requisites
Before you get started, here’s what you’ll need up-front:
A GitHub account and a repository. I would highly recommend a private repo, as you will be deploying a self-hosted runner which is linked to this repo - this will be able to run code in your environment. GitHub make this recommendation here.
An Azure Stack Hub environment with a Tenant Subscription that you can access (assumption here is we’re using Azure AD as the identity provider)
(Optional) A service principal with contributor rights to the Azure Stack Hub tenant subscription. If you don’t have this, I detail how this can be done later..
A GitHub Personal Access Token (PAT)
Credentials to connect to Azure Stack Hub
First thing we need is a service principal that has rights to the tenant subscription (I recommend contributor role). We will use these credentials to create a secret within our GitHub repo that we will use to connect to the subscription.
If you don’t already have an SP, following the official documentation helps us create one.
All my examples are being run from Linux and Azure CLI (Ubuntu WSL to be specific :) )
First, register your Azure Stack Hub tenant environment (if not already done so)
az cloud register \
    -n "AzureStackHubTenant" \
    --endpoint-resource-manager "https://management.<region>.<FQDN>" \
    --suffix-storage-endpoint ".<region>.<FQDN>" \
    --suffix-keyvault-dns ".vault.<region>.<FQDN>" \
    --endpoint-active-directory-graph-resource-id "https://graph.windows.net/" \
    --profile 2019-03-01-hybrid \
We need to connect to our Azure Stack Hub environment so that when the Service Principal is created, we can assign it to a scope.
Once the environment is defined, we need to make sure this is active.
az cloud set -n AzureStackHubTenant
Run this command to confirm that it is set correctly:
az cloud list -o table

Next, let’s connect to our subscription hosted on Azure Stack Hub.
az login
If there’s more than one subscription, you might need to specify which subscription you want to connect to.
az account set --subscription <subName>

We can see above that I have set the active subscription to ‘DannyTestSub’.
Next, we want to create our service principal. To make things easier, let’s have the CLI do the work in assigning the scope to the user subscription:
#Retrieve the subscription ID
SUBID=$(az account show --query id -o tsv)
az ad sp create-for-rbac --name "ASH-github-runner" --role contributor \
    --scopes /subscriptions/$SUBID \
    --sdk-auth
Running that should produce something like the following in my environment:

It is important that we copy the JSON output as-is , we need this exact format to create our GitHub secret. Theoretically, if you already have a clientID and secret, you could construct your own JSON formatted credential like this:
{
  "clientId": "<your_ClientID>",
  "clientSecret": "<your_Client_secret>",
  "subscriptionId": "<Azure_Stack_Hub_Tenant SubscriptionID>",
  "tenantId": "<Your_Azure_AD_Tenant_Id>",
  "activeDirectoryEndpointUrl": "https://login.microsoftonline.com/",
  "resourceManagerEndpointUrl": "https://management.<REGION>.<FQDN>",
  "activeDirectoryGraphResourceId": "https://graph.windows.net/",
  "sqlManagementEndpointUrl": null,
  "galleryEndpointUrl": "https://providers.<REGION>.local:30016/",
  "managementEndpointUrl": "https://management.<REGION>.<FQDN>"
}
Now we have the credentials, we need to set up a secret within GitHub.
From the GitHub portal, connect to your private repo that you will use for Azure Stack Hub automation.

Click on the Settings cog

Click on Secrets

Click on ‘New repository secret’

Enter a name (I’m using AZURESTACKHUB_CREDENTIALS), paste in the JSON content for the SP that were previously created, and then click on Add Secret.

You should now see your newly added credentials under Action Secrets.
So we have our credentials and have setup an Actions runner secret, now we need an Actions Runner to run our workflows against within our Azure Stack Hub environment.
If you already have a Windows Server or Linux host running in your Azure Stack Hub tenant subscription, you can follow the manual steps, per the guidance given under the Settings/ Actions / Runner config page:

You can select the OS type of the system you have running and follow the commands.
Note: The ./config.(cmd|sh) command uses a token which has a short lifetime, so be aware if you use this method and are expecting to use it for automating self-hosted runner deployments!

The above method works and is OK if you want to quickly test capabilities. However, I wanted the ability to automate the runner provisioning process, from the VM to the installation of the runner agent.
I did this by creating an ARM template that deploys an Ubuntu VM and runs a Bash script that installs necessary tools (e.g. Azure CLI, Docker, Kubectl, Helm, etc.) and most importantly, deploys the agent and dynamically retrieves a token from GitHub to add our runner. One crucial parameter we need is a GitHub Personal Access Token (PAT). We need this to authenticate to the GitHub Actions API to generate the actions token.
To create the PAT, highlight your user account from the top right of the GitHub portal:

Click Settings

Click Developer Settings

Select Personal access tokens and then Generate new token

Set the scope to repo

Scroll to the bottom and then click Generate token

Make sure to copy the PAT, as you can’t retrieve it afterwards (you could always regenerate it if needed :) )
Now we have the PAT, we can go ahead and deploy the VM using the ARM template I created.
Go ahead and get it from
https://github.com/dmc-tech/AzsHubTools/blob/main/ghRunner/template.json
There’s nothing fancy; it deploys a VNET, NIC, Public IP, VM (it uses Ubuntu 18.04 - make sure you have it available via the Azure Stack Hub Marketplace!) and then deploys a Custom script to install a bunch of tools and the runner agent. The only parameters you will need to provide are:
| Parameter | Description |
|---|---|
| gitHubPat | Personal Access Token used to access GitHub |
| gitHubRepo | GitHub Repo to create the Self Hosted Runner |
| gitHubOwner | GitHub Owner or Organisation where the repo is located for the Runner |
| adminPublicKey | Public SSH key used to login to the VM |
If you’re not sure how the Owner and Repo are derived, it’s simple:

To generate the adminPublicKey on Windows systems, I prefer to use MobaXterm. See the end of this post on how to generate the Private/ Public key
Deploy using the ARM template within your tenant subscription.

When deployed, it takes me about 10 minutes in my environment to complete.

We can see that the agent has successfully deployed by checking the Actions / Runners settings within our GitHub repo:

Success!!!
Now we can go ahead and test a workflow.
Within your repo, if it doesn’t already exist, create the following directory structure:
/.github/workflows
This is where the workflow yaml files are stored that our actions will use.
For a simple test, go ahead and copy the following into this folder in your repo (and commit it to the main branch!):
https://github.com/dmc-tech/AzsHubTools/blob/main/.github/workflows/testAzureStackHub.yml
The workflow is manually triggered ( workflow_dispatch ), and prompts for a parameter ( the name of the subscription you want to run the action against)
on:
  workflow_dispatch:
    inputs:
      subscription:
        description: 'Azure Stack Hub User subscription'
        required: true
        default: 'TenantSubscription'

name: Test GitHub Runner in an Azure Stack Hub environment

env:
  ACTIONS_ALLOW_UNSECURE_COMMANDS: 'true'

jobs:
  azurestackhub-test:
    runs-on: self-hosted
    steps:
      - uses: actions/checkout@main
      - name: Login to AzureStackHub with CLI
        uses: azure/login@releases/v1
        with:
          creds: ${  }
          environment: 'AzureStack'
          enable-AzPSSession: false

      - name: Run Azure CLI Script Against AzureStackHub
        run: |
          hostname
          subId=$(az account show --subscription ${  } --query id -o tsv)
          az account set --subscription ${  }

          az group list --output table
You can see that the workflow refers to the secret we defined earlier: secrets.AZURESTACKHUB_CREDENTIALS
The workflow configures the Azure Stack Hub tenant environment on the runner VM (using the values from the JSON stored in the secret), connects using the service principal and secret and then runs the Azure CLI commands to list the resource groups in the specified subscription.
To run the workflow, head over to the GitHub site:

Click on Actions and then the name of the workflow we added: ‘Test GitHub Runner in an Azure Stack Hub environment’

Click on Run workflow and type in the name of your Azure Stack Hub tenant subscription (this caters for multiple subscriptions)

Hopefully you will see that the action ran successfully as denoted above. Click on the entry to check out the results.

Click on the job and you can see the output. You can see that the Azure CLI command to list the resource groups for the subscription completed and returned the results.
With that, we’ve shown how we can automate the deployment of a self-hosted runner on Azure Stack Hub and demonstrated how to run a workflow.
I really like GitHub Actions and there’s scope for some powerful automation, so although what I’ve shown is very simple, I hope you find this of use and helps you get started.
Appendix: Creating SSH keys in MobaXterm

1. Click on Tools
2. Select MobaKeyGen (SSH key generator)

1. Click on Generate
2. Copy the Public key for use with the ARM template.
3. Save the Private Key (I recommend setting a Key passphrase). You’ll need this if you need to SSH to the VM!
ASDK 2008 installation fix
Here’s a quick post on installing ASDK 2008, as there seems to have been a recent change to the names of Azure AD roles that causes the ASDK install routine to fail when it is checking to see if the supplied Azure AD account has the correct permissions on the AAD tenant.
Following the installation docs: https://docs.microsoft.com/en-us/azure-stack/asdk/asdk-install?view=azs-2008, after a short time of running the PowerShell routine you will be prompted for the Azure AD global admin account. Once you’ve done this, it will be verified, but will fail with an error similar to below:
Get-AzureAdTenantDetails : The account you entered 'admin@contoso.onmicrosoft.com' is not an administrator of any Azure Active
Directory tenant.
At C:\CloudDeployment\Setup\Common\InstallAzureStackCommon.psm1:546 char:27
+ ... ntDetails = Get-AzureAdTenantDetails -AADAdminCredential $InfraAzureD ...
+                 ~~~~~~~~~~~~~~~~~~~~~~~~~~~~~~~~~~~~~~~~~~~~~~~~~~~~~~~~~
    + CategoryInfo          : NotSpecified: (:) [Write-Error], WriteErrorException
    + FullyQualifiedErrorId : Microsoft.PowerShell.Commands.WriteErrorException,Get-AzureADTenantDetails
The reason for this is that there is a function called Get-AADTenantDetail in the c:\CloudDeployment\Setup\Common\AzureADConfiguration.psm1 module that checks if the supplied account has the correct permissions. It currently checks for “Company Administrator”, but that name no longer exists, it should be changed to “Global Administrator” .
To fix this, edit c:\CloudDeployment\Setup\Common\AzureADConfiguration.psm1, and navigate to line 339. Make the following change:
$roleOid = Invoke-Graph -method Get -uri $getUri -authorization $authorization | Select-Object -ExpandProperty Value | Where displayName -EQ 'Global Administrator' | Select-Object -ExpandProperty objectIdNote: In order to see the module that needs the change, you have to run through the install routine once and let it fail, as it expands the setup directories from a NuGet package if they don’t exist.
If you re-run the install routine, it should get past this stage (assuming the account you provided is a global admin for the tenant :) )

Hands on with Azure Arc enabled data services on AKS HCI - part 3
This is part 3 in a series of articles on my experiences of deploying Azure Arc enabled data services on Azure Stack HCI AKS.
Part 1 discusses installation of the tools required to deploy and manage the data controller.
Part 2 describes how to deploy and manage a PostgreSQL hyperscale instance.
Part 3 describes how we can monitor our instances from Azure.
In the preview version, if you want to view usage data and metrics for your Arc enabled data services instances, you have to run some manual azdata CLI commands to first dump the data to a JSON file, and another command to upload to your Azure subscription. This can be automated by running it as a scheduled task, or CRON job.
Pre-requisites
Before we can upload and data, we need to make sure that some pre-reqs are in place.
If you’ve been following the previous two parts, the required tools should already be in place : Azure (az) and Azure Data (azdata) CLIs.
We also need to make sure the the necessary resource providers are registered (Microsoft.AzureArcData). Following the instructions here shows how you can do it using the Azure CLI, and is straightforward. The documents don’t show how you can use PowerShell to achieve the same outcome, so here are the commands needed, if you want to try it out :) :
$Subscription = '<your subscriptionName'
$ResourceProviderName = 'Microsoft.AzureArcData'

$AzContext = Get-AzContext

if (-not ($AzContext.Subscription.Name -eq $Subscription)) {
    Login-AzAccount -Subscription $Subscription
}


$resourceProviders = Get-AzResourceProvider -ProviderNamespace $ResourceProviderName
$resourceProviders | Select-Object ProviderNamespace, RegistrationState
$resourceProviders | Where-Object RegistrationState -eq 'NotRegistered' | Register-AzResourceProvider

Get-AzResourceProvider -ProviderNamespace $ResourceProviderName  | Select-Object ProviderNamespace, RegistrationState
The next recommended pre-req is to create a service principal that can be used to automate the upload of the data. This is easy to create using the Azure CLI and as detailed here.
az ad sp create-for-rbac --name azure-arc-metrics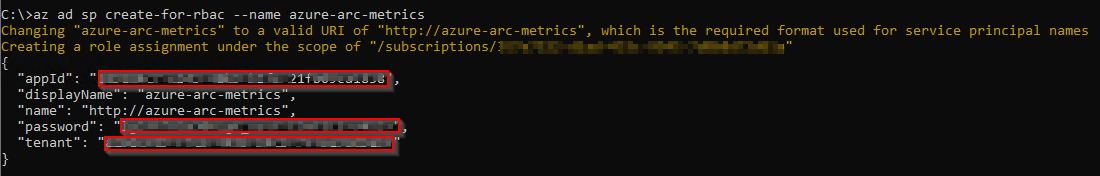
Make a note of the appId (SPN_CLIENT_ID), password (SPN_CLIENT_SECRET) and tenant (SPN_TENANT_ID) values that are returned after the command has been run.
Run the following command to get the Subscription Id.
az account show --query {SubscriptionId:id}Make a note of the output.

The next thing to do is to assign the service principal to the Monitoring Metrics Publisher role in the subscription.
az role assignment create --assignee <appId> --role "Monitoring Metrics Publisher" --scope subscriptions/<Subscription ID>
The last thing to do is to setup a Log Analytics Workspace (if you don’t already have one). Run the following Azure CLI commands to create a resource group and workspace:
az group create --location EastUs --name AzureArcMonitoring
az monitor log-analytics workspace create --resource-group AzureArcMonitoring --workspace-name AzureArcMonitoring
From the output, take note of the Workspace Id.

The last thing we need to retrieve is the shared key for the workspace. Run the following:
az monitor log-analytics workspace get-shared-keys --resource-group AzureArcMonitoring --workspace-name AzureArcMonitoring-demoTake note of the primary or secondary key.

Retrieving data
Retrieving data from our data controller and uploading to Azure is currently a two step process.
The following three commands will export the usage, metrics and log data to your local system:
azdata arc dc export --path c:\temp\arc-dc-usage.json --type usage --force
azdata arc dc export --path c:\temp\arc-dc-metrics.json --type metrics --force
azdata arc dc export --path c:\temp\arc-dc-logs.json --type logs --force
Note: Be careful using the —force switch, as it will overwrite the file specified. If you haven’t uploaded the existing data from that file to Azure, there is a potential you will miss those collected metrics for the period.

The second step, we have to upload the data to our Azure Subscription.
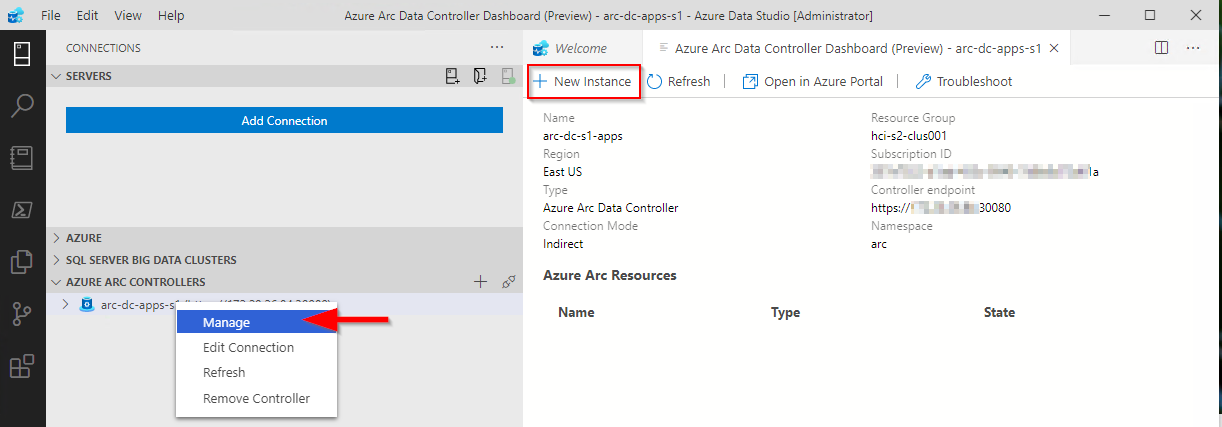
You can check the resource group that the data controller was deployed to via the data controller dashboard in ADS:
Once you have the service principal details, run the following commands:
azdata arc dc upload --path c:\temp\arc-dc-usage.json
azdata arc dc upload --path c:\temp\arc-dc-metrics.json
azdata arc dc upload --path c:\temp\arc-dc-logs.json
For each command. it will prompt for the tenant id, client id and the client secret for the service principal. Azdata currently does not allow you to specify these parameters, but you can set them as Environment variables, so you are not prompted for them. For the log upload, a Log Analytics Workspace ID and secret is required

Here’s an example PowerShell script that you can use to automate the connection to your data controller, retrieve the metrics and also upload to your Azure subscription:
$Env:SPN_AUTHORITY='https://login.microsoftonline.com'
$Env:SPN_TENANT_ID = "<SPN Tenent Id>"
$Env:SPN_CLIENT_ID = "<SPN Client Id>"
$Env:SPN_CLIENT_SECRET ="<SPN Client secret>"
$Env:WORKSPACE_ID = "<Your LogAnalytics Workspace ID"
$Env:WORKSPACE_SHARED_KEY = "<Your LogAnalytics Workspace Shared Key"
$Subscription = "<Your SubscriptionName> "


$Env:AZDATA_USERNAME = "<Data controller admin user>"
$Env:AZDATA_PASSWORD = "<Data controller admin password>"
$DataContollerEP = "https://<DC IP>:30080"

# Find your contexts: kubectl config get-contexts
$kubeContextName = 'my-workload-cluster-admin@my-workload-cluster'

$dataPath = 'c:\temp'

kubectl config use-context $kubeContextName

azdata login -e $DataContollerEP

az login --service-principal -u $Env:SPN_CLIENT_ID -p $Env:SPN_CLIENT_SECRET --tenant $Env:SPN_TENANT_ID

if ($Subscription) {
    az account set --subscription $Subscription
}

if (-not (test-path -path $dataPath)) {
    mkdir $dataPath
}

cd $dataPath

. azdata arc dc export --type metrics --path metrics.json --force
. azdata arc dc upload --path metrics.json

. azdata arc dc export --type usage --path usage.json --force
. azdata arc dc upload --path usage.json

. azdata arc dc export --type logs --path logs.json --force
. azdata arc dc upload --path logs.json
After you have uploaded the data to Azure, you should be able to start to view it in the Azure Portal.
At the time of writing, if you try and use the link from the Azure Arc Data Controller Dashboard in ADS, it will throw an error:


The reason for this is that the URI that is constructed by the ARC extension isn’t targeting the correct resource provider. It uses Microsoft.AzureData, when the correct one is Microsoft.AzureArcData. I assume this will be fixed in an imminent release of the extension soon as I think the namespace has changed very recently. In the meantime, it can be manually patched by doing the following (correct for version 0.6.5 of the Azure Arc extension ) :
Edit:
%USERPROFILE%\.azuredatastudio\extensions\microsoft.arc-0.6.5\dist\extension.jsFind and replace all instances of Microsoft.AzureData with Microsoft.AzureArcData (there should be 4 in total).

If the file has no formatting (due to it being .js) just do the find/replace. I used a VS Code extension (JS-CSS-HTML Formatter) to beautify the formatting as can be seen in the screen grab above.
Save the file and restart the Azure Data Studio Session. When you now click on Open in Azure Portal, it should open as expected.

As it is, we can’t actually do that much from the portal, but enhanced capabilities will come in time
We can view a bit more about out PostgreSQL instances, however, looking similar to the Azure Data Studio Dashboard:

When looking at Metrics, make sure you select the correct namespace - in my example it’s postgres01

The integration with the portal and the uploaded logs is a bit hit and miss. I found that clicking on the Logs link from my resource did not point me to the Log Analytics workspace I specified when I ran my script, so I had to manually target it before I could query the logs.


Thanks for reading this series, and I hope it will help others get around some of the small gotchas I encountered when evaluating this exciting technology stack!

Hands on with Azure Arc enabled data services on AKS HCI - part 2
This is part 2 in a series of articles on my experiences of deploying Azure Arc enabled data services on Azure Stack HCI AKS.
Part 1 discusses installation of the tools required to deploy and manage the data controller.
Part 2 describes how to deploy and manage a PostgreSQL hyperscale instance.
Part 3 describes how we can monitor our instances from Azure.
First things first, the PostgreSQL extension needs to be installed within Azure Data Studio. You do this from the Extension pane. Just search for ‘PostgreSQL’ and install, as highlighted in the screen shot below.

I found that with the latest version of the extension (0.2.7 at time of writing) threw an error. The issue lies with the OSS DB Tools Service that gets deployed with the extension, and you can see the error from the message displayed below.

After doing a bit of troubleshooting, I figured out that VCRUNTIME140.DLL was missing from my system. Well, actually, the extension does have a copy of it, but it’s not a part of the PATH, so can’t be used. Until a new version of the extension resolves this issue, there are 2 options you can take to workaround this.
Install the Visual C++ 2015 Redistributable to your system (Preferred!)
Copy VCRUNTIME140.DLL to %SYSTEMROOT% (Most hacky; do this at own risk!)
You can find a copy of the DLL in the extension directory:
%USERPROFILE%\.azuredatastudio\extensions\microsoft.azuredatastudio-postgresql-0.2.7\out\ossdbtoolsservice\Windows\v1.5.0\pgsqltoolsservice\lib\_pydevd_bundle
Make sure to restart Azure Data Studio and check that the problem is resolved by checking the output from the ossdbToolsService. The warning message doesn’t seem to impair the functionality of the extension, so I ignored it.

Now we’re ready to deploy a PostgreSQL cluster. Within ADS, we have two ways to do this.
1. Via the data controller management console:
2. From the Connection ‘New Deployment…’ option. Click on the ellipsis (…) to present the option.

Whichever option you choose, the next screen that is presented are similar to one another. The example I‘ve shown is via the ‘New Connection’ path and shows more deployment types. Installing via the data controller dashboard, the list is filtered to what can be deployed to the cluster (the Azure Arc options).

Select PostgreSQL Hyperscale server groups - Azure Arc (preview), make sure that the T&C’s acceptance is checked and then click on Select.
The next pane that’s displayed is where we defined the parameters for the PostgreSQL instance. I’ve highlighted the options you must fill in as a minimum. In the example, I’ve set the number of workers to 3. By default it is set to 0. If you leave it as the default, a single worker is deployed.
Note: If you’re deploying more than one instance to your data controller. make sure to seta unique Port for each server group. The default is 5432

Clicking on Deploy runs through the generated Jupyter notebook.

After a short period (minutes), you should see it has successfully deployed.

ADS doesn’t automatically refresh the data controller instance, so you have to manually do this.

Once refreshed, you will see the instance you have deployed. Right click and select Manage to open the instance management pane.

As you can see, it looks and feels similar to the Azure portal.
If you click on the Kibana or Grafana dashboard links, you can see the logs and performance metrics for the instance.
Note: The Username and password are are what you have set for the data controller, it is not the password you set for the PostgreSQL instance.

Example Kibana logs

Grafana Dashboard
From the management pane, we can also retrieve the connection strings for our PostgreSQL instance. It gives you the details for use with various languages.

Finally in settings, Compute + Storage in theory allows you to change the number of worker nodes and the configuration per node. In reality, this is read-only from within ADS, as changing any of the values and saving them has no effect. If you do want to change the config, we need to revert to the azdata CLI. Jump here to see how you do it.

In order to work with databases and tables on the newly deployed instance, we need to add our new PostgreSQL server to ADS.
From Connection strings on our PostgreSQL dashboard, make a note of the host IP address and port, we’ll need this to add our server instance.

From the Connections pane in ADS, click on Add Connection.
From the new pane enter the parameters:
| Parameter | Value |
|---|---|
| Connection type | PostgreSQL |
| Server name | name you gave to the instance |
| User name | postgres |
| Password | Password you specified for the postgreSQL deployment |
| Database name | Default |
| Server group | Default |
| Name (Optional) | blank |
Click on Advanced, so that you can specify the host IP address and port

Enter the Host IP Address previously noted, and set the port (default is 5432)

Click on OK and then Connect. If all is well, you should see the new connection.

Scaling Your Instance
As mentioned before, if you want to be modify the running configuration of your instance, you’ll have to use the azdata CLI.
First, make sure you are connected and logged in to your data controller.
azdata login --endpoint https://<your dc IP>:30080
Enter the data controller admin username and password

To list the postgreSQL servers that are deployed, run the following command:
azdata arc postgres server list
To show the configuration of the server:
azdata arc postgres server show -n postgres01
Digging through the JSON, we can see that the only resources requested is memory. By default, each node will use 0.25 cores.

I’m going to show how to increase the memory and cores requested. For this example, I want to set 1 core and 512Mb
azdata arc postgres server edit -n postgres01 --cores-request 1 --memory-request 512Mi
If we show the config for our server again, we can see it has been updated successfully

You can also increase the number of workers using the following example
azdata arc postgres server edit -n postgres01 --workers 4Note: With the preview, reducing the number of workers is not supported.

If you do make any changes via azdata, you will need to close existing management panes for the instance and refresh the data controller instance within ADS for them to be reflected.


Currently, there does not appear to be a method to increase the allocated storage via ADS or the CLI, so make sure you provision your storage sizes sufficiently at deployment time.
You can deploy more than one PostgreSQL server group to you data controller, the only thing you will need to change is the name and the port used

You can use this command to show a friendly table of the port that the server is using:
azdata arc postgres server show -n postgres02 --query "{Server:metadata.name, Port:spec.service.port}" --output table
In the next post, I’ll describe how to upload logs and metrics to Azure for your on-prem instances.

Hands on with Azure Arc enabled data services on AKS HCI - part 1
As I’ve been deploying and testing AKS on Azure Stack HCI, I wanted to test the deployment and management of Azure Arc enabled data services running on one of my clusters.
This post is part one of a series that documents what I did to setup the tools and deploy a data controller. In other posts, I’ll detail deploying a PostgreSQL instance and how to upload metrics and usage data to Azure.
Part 1 discusses installation of the tools required to deploy and manage the data controller.
Part 2 describes how to deploy and manage a PostgreSQL hyperscale instance.
Part 3 describes how we can monitor our instances from Azure.
Hopefully it will give someone some insight into what’s involved to get you started.
First things first, I’ll make the assumption that you either have an Azure Stack HCI cluster with AKS running as that is the setup I have. If you have another K8s cluster, the steps should be easy enough to follow and adapt :) .
Install the tools
First things first, we need to set up the tools. As I’m on Windows 10, the instructions here are geared towards Windows, but I will link to the official documentation for other OS’.
- Install Azure Data CLI (azdata)
- Run the Windows Installer to deploy.
- Official documentation
- Install Azure Data Studio
- Run the Windows Installer to deploy.
- Official documentation
Install Azure CLI
- Install using the the following PowerShell command:
Invoke-WebRequest -Uri https://aka.ms/installazurecliwindows -OutFile .\AzureCLI.msi; Start-Process msiexec.exe -Wait -ArgumentList '/I AzureCLI.msi /quiet'; rm .\AzureCLI.msi - Official documentation
- Install using the the following PowerShell command:
Install Kubernetes CLI (kubectl)
- Install using the the following PowerShell command:
Install-Script -Name 'install-kubectl' -Scope CurrentUser -Force install-kubectl.ps1 [-DownloadLocation <path>] - Official documentation
- Install using the the following PowerShell command:
Once you’ve installed the tools above, go ahead and run Azure Data Studio - we need to install some additional extensions before we can go ahead and deploy a data controller.
Open the Extensions pane, and install Azure Arc and Azure Data CLI as per the screenshot below.

Deploying the data controller
Once the extensions are installed, you’re ready to deploy a data controller, which is required before you can deploy the PostgreSQL or SQL DB instances within your K8s cluster.
Open the Connections pane, click the ellipsis and select New Deployment:

From the new window, select Azure Arc data controller (preview) and then click Select.

This will bring up the Create Azure Arc data controller install steps. Step 1 is to choose the kubeconfig file for your cluster. If you’re running AKS HCI, check out my previous post on managing AKS HCI clusters from Windows 10; it includes the steps required to retrieve the kubeconfig files for your clusters.

Step 2 is where you choose the config profile. Make sure azure-arc-aks-hci is selected, then click Next.

Step 3 is where we specify which Azure Account, Subscription and Resource Group we want to associate the data controller with.
Within the Data controller details, I specified the ‘default’ values:

| Parameter | Value |
|---|---|
| Data controller namespace | arc |
| Data controller name | arc-dc |
| Storage Class | default |
| Location | East US |
I’ve highlighted Storage class, as when selecting the dropdown, it is blank. I manually typed in default. This is a bug in the extension and causes an issue in a later step, but it can be fixed :)
I’ve highlighted the Storage class, as when selecting the dropdown, it is blank. I manually typed in default. This is a bug in the extension and causes an issue in a later step, but it can be fixed :)
Click Next to proceed.
Step 4 generates a Jupyter notebook with the generated scripts to deploy our data controller. If it’s the first time it has been run, then some pre-reqs are required. The first of these is to configure the Python Runtime.
I went with the defaults; click Next to install.

Once that’s in place, next is to install Jupyter. There are no options, just click on Install.

Once Jupyter has been deployed, try clicking Run all to see what happens. You’ll probably find it errors, like below:

I’ve highlighted the problem - the Pandas module is not present. This is simple enough to fix.
From within the notebook, click on the Manage Packages icon.

Go to Add new and type in pandas into the search box. Click on install to have Pip install it.

In the Tasks window, you’ll see when it has been successfully deployed

With the pandas module installed, try running the notebook again. You might find that you get another error pretty soon.

This time, the error indicates that there is a problem with the numpy module that’s installed. The issue is that on Windows, there is a problem with the latest implementation, so to get around it, choose an older version of the module.
Click on Manage Packages as we did when installing the pandas module.
Go to Add new and type in numpy into the search box. Select Package Version 1.18.5 . Click on install to have Pip install it.

You may also see some warnings regarding the version of pip, you can use the same method as above to get the latest version.

OK, once all that is done, run the notebook again. I found that yet another error was thrown. Remember when I said there was a bug when setting the Storage Class? Well, it looks like even though I manually specified it as ‘default’ it didn’t set the variable, as can be seen in the output below.

The -sc parameter is not set. Not to worry, we can change this in the set variables section of the notebook:
arc_data_controller_storage_class = 'default'
And again, Run all again and when the Create Azure Arc Data Controller cell is run, you’ll notice in the output the parameter is correctly set this time around.

From here on, there shouldn’t be any problems and the data controller deployment should complete successfully. Make a note of the data controller endpoint URL, as you’ll need this for the next step.

Connect to the Controller
Now that the data controller has been deployed, we need to connect to it from within ADC.
From the Connection pane, expand Azure Arc Controllers and click Connect Controller.

Within the Connect to Existing Controller pane, enter the Controller URL recorded from the previous step, Name, Username and password that were specified when setting up the data controller.
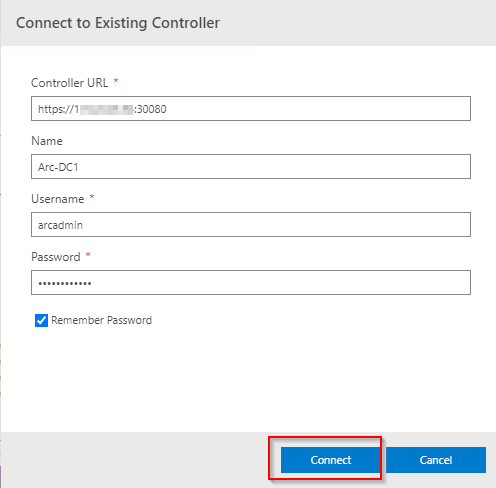
All being good, you’ll now see the entry in the connections pane.

As you can see, there were a few things I had to workaround, but as this is a Preview product, it doesn’t bother me as it means I learn more about what is going on under the covers by getting it to work. I’m sure that by the time it is GA, the issues will be resolved.
Topic Search
Posts by Date
- August 2025 1
- March 2025 1
- February 2025 1
- October 2024 1
- August 2024 1
- July 2024 1
- October 2023 1
- September 2023 1
- August 2023 3
- July 2023 1
- June 2023 2
- May 2023 1
- February 2023 3
- January 2023 1
- December 2022 1
- November 2022 3
- October 2022 7
- September 2022 2
- August 2022 4
- July 2022 1
- February 2022 2
- January 2022 1
- October 2021 1
- June 2021 2
- February 2021 1
- December 2020 2
- November 2020 2
- October 2020 1
- September 2020 1
- August 2020 1
- June 2020 1
- May 2020 2
- March 2020 1
- January 2020 2
- December 2019 2
- November 2019 1
- October 2019 7
- June 2019 2
- March 2019 2
- February 2019 1
- December 2018 3
- November 2018 1
- October 2018 4
- September 2018 6
- August 2018 1
- June 2018 1
- April 2018 2
- March 2018 1
- February 2018 3
- January 2018 2
- August 2017 5
- June 2017 2
- May 2017 3
- March 2017 4
- February 2017 4
- December 2016 1
- November 2016 3
- October 2016 3
- September 2016 5
- August 2016 11
- July 2016 13