
SQL Counters via Azure Arc
Walk through how to collect SQL counter using Data collection Rule and displaying the results on a workbook an Azure Dashboard.
Microsoft is rapidly expanding the services and features available from the Azure Arc SQL Extension. As this moves into GA and more visibility features get added and importantly, features that allow actions EG controlling backup and even patching using Azure to create a management layer for your SQL Server estate outside of Azure becomes more viable.
Let’s take a brief look at grabbing SQL-specific performance counters to Azure Monitor Metrics.
We need to create a Data Collection Rule (DCR). I am not using Data Collection Endpoints (DCE), but you may want to consider this in your environment.

Select the Arc Resource you want to add
now we need to add some Performance counter

it will add a bunch by default; select None, then Custom to clear all.
Unfortunately, currently, you can not see the SQL counters from this view, so you’ll have to go collect what you want from another source.
You can use Perfmon, unfortunately you cant copy from perfmon.
this query will provide a list
SELECT COUNT(*) FROM sys.dm_os_performance_counters;
Here is a list I have extracted for this DCR
\SQLServer:General Statistics\User Connections
\SQLServer:General Statistics\Logins/sec
\SQLServer:General Statistics\Transactions
\SQLServer:Databases(_Total)\Active Transactions
\SQLServer:SQL Statistics\Batch Requests/sec
\SQLServer:SQL Statistics\Logical Connections
\SQLServer:SQL Statistics\SQL Compilations/sec
\SQLServer:SQL Statistics\SQL Re-Compilations/sec
Paste it in line by line, Add, tick, Delete line, next counter. Adjust the Sample rate as needed. I have used the default 60 seconds. For large SQL servers estates, you might want to consider increasing this depending on your needs.
It’s worth considering building a template for this if you want to do this repeatedly. This resource type has some challenging layers to work through for deployment. Microsoft reference material can be found here.

we pipe these into Azure Monitor Metrics Which is still in preview and for this exercise I will also push the data into a log analytics instance.

as of this writing the metrics for hybrid compute fail to be added to scope of Azure Monitor. For the remainder of this example we will use Log Analytics Workspace for metrics.
Heading over to the Log Analytics Workspace. You can create various Kusto queries to integrate these SQL Metrics
Perf
| where ObjectName == 'SQLServer:General Statistics' and CounterName == 'User Connections'
| project TimeGenerated, Computer, ObjectName, CounterName, CounterValue
| summarize avg(CounterValue) by bin(TimeGenerated,60m) , Computer
| render timechartYou can send this to a Workbook or Dashboard

We can now see the data on a chart in a workbook. By saving the you can give the workbook a name and save it to a resource group

Alternatively, you can publish this to an Azure Dashboard. I am going to use the dashboard I created here Arc SQL Extension - Best Practices Assessment — Crying Cloud

This displays a tile here. You can continue to add tiles and edit the queries. You build workbooks and dashboards to target the specific metrics about your Arc-enabled SQL Servers.

Arc SQL Extension - Best Practices Assessment
A look into Azure Arc SQL Extension and how best practices assessment and what it can extract from an Azure Arc enabled SQL Server.
Azure Arc help increase the visibility of your IT estate outside of Azure. Layering on top of the SQL Extension, we can bring a centralized view of your SQL Servers and databases, and now other control features help with management activities.
Let’s take a look at the Best practices assessment (BPA)

First thing to know is “Best practices assessment is only available for SQL Server with Software Assurance, SQL subscription, or with Azure pay-as-you-go billing. Update the license type appropriately. Learn more”

If you want to look at you’re overall licenses we can run a query against the Azure Resource Graph. While we are at it lets add it to a dashboard.
resources
| extend SQLversion = properties.version
| extend SQLEdition = properties.edition
| extend licensetype = properties.licenseType
| where type == ("microsoft.azurearcdata/sqlserverinstances")
| project id, name,SQLversion,SQLEdition, licensetype
Note: as of writing this, the property is ‘lincetype’ not ‘licensetype’ this will likely be corrected.

there are some minor edits to the query in this image, added ID and selected ‘formatted results’ so the record is linked.
We can now see the query on the dashboard and see the license types for the servers. We have a ‘Paid’ for sv5-su5-6320018 so we can configure BPA for both instances.

You can change the SQL Server Registration to automatically handle the licensing selection


To enable an assessment pick a Log Analytics Workspace, click “Enable assessment”

The prerequisites are listed here. One to make sure you have completed is.
The SQL Server built-in login NT AUTHORITY\SYSTEM must be the member of SQL Server sysadmin server role for all the SQL Server instances running on the machine.
We can see what resource the deployment creates.

checking the data collection rule

We can see the data source is the local files is checking for CSVs here
C:\Windows\System32\config\systemprofile\AppData\Local\Microsoft SQL Server Extension Agent\Assessment\*.csv
and uploading them into the table SqlAssessment_CL in the LA Workspace instance. We can see the table

Depending on your purpose you may want to consider changing the table settings.

Depending on the size of the servers and the number of databases it might take a while to run. The default schedule is weekly but adjustable.

Once its completes you will be able to explore the results.

You can look at the query that is integrating the SqlAssessment_CL table. The data is being dumped into a single RawData field that needs to be parsed. This query will help you get a jump start on accessing the data.
There is a to explore with the Azure Arc SQL Extension and various ways to use the platform to provide more visibility and control over your SQL servers.

Azure Monitor Container Insights cost presets (preview)
Microsoft have recently added a new preview feature within the Azure portal to perform some cost optimization on the Container Insights data that is collected to a Log Analytics workspace. This is helpful as going with the default collection could leave you with unnecessary cost, as you don’t care about particular namespaces, or you’ve got a non-production cluster, so don’t care about collecting data every minute, but still want to monitor your cluster and workloads.
Here’s how you can quickly set this up.
From the Azure Portal, open up the blade for your Kubernetes resource (works for both AKS and Arc enabled Kubernetes
Navigate to Monitoring / Insights and then Configure azure monitor (If you’ve not previously enabled it)

If you have configure container insights previously, click on Monitor Settings :

From the blade that’s opened, you’ll need to make sure that Use Managed Identity (preview) is enabled. This appears for Azure Arc for Kubernetes enabled clusters. If this isn’t checked, you will find the Costs presets (preview) list box is grayed out.

From the list box, you can choose from the following profiles:
Standard
Cost-optimized
Custom
None
Standard profile has the following settings:
1 minute collection frequency
No namespace filtering
Syslog collection disabled

Cost-optimized profile has the following settings:
5 minute collection frequency
3 namespaces excluded [kube-system, gatekeeper-system, azure-arc]
Syslog collection disabled

You can use the defined standards as the basis for your own custom collection profile.
Select a profile from the drop down and click on Edit collection settings.

You can now modify the configuration to meet your requirements. For ContainerLog filtering, you can use the link here for more information. The profile will be saved as Custom within the Cost presets list box.
You can also enable Syslog collection for security events on your nodes, but that will increase your Log Analytic costs somewhat, depending on how busy your cluster is!

AKS Edge Essentials - deploying the latest version
Just my luck, straight after creating my last blog post on deploying and using AKS Edge Essentials, a new version of the tool was released which renders some of the previous instructions and config invalid. This is due to some of the steps being streamlined and an updated JSON schema. (Thanks to @LiorKamrat for highlighting this to me)
For information, the previous articles were using the following module versions:
| AKS Edge version | 0.7.22335.1024 |
| AKS Edge shell version | 1.0.221212.1200 |
| AKS Edge deploy version | 1.0.230123.1500 |
The latest modules are the following versions:
| AKS Edge version | 1.0.266.0 |
| AKS Edge shell version | 1.0.230203.1200 |
| AKS Edge deploy version | 1.0.230203.1200 |
Here’s what I did to deploy the new version.
Uninstall AKS Edge Essentials
If you have previous versions of AKS Edge deployed, go ahead and remove the cluster and then remove the tool as per the official documentation instructions: https://learn.microsoft.com/en-gb/azure/aks/hybrid/aks-edge-howto-uninstall
Install the latest version of AKS Edge Essentials
Preparing your system follows the same pattern as per my previous instructions (here), but with the new version of the tool, you can simplify the process by using the Install-AksEdgeHostFeatures command from the AKSEdgePrompt PowerShell Window, once the latest version of the AKS Edge tool has been installed.
Get the latest version of AKS Edge for K8s here: https://aka.ms/aks-edge/k8s-msi
(The MSI file will be named AksEdge-K8s-1.0.266.0.msi)
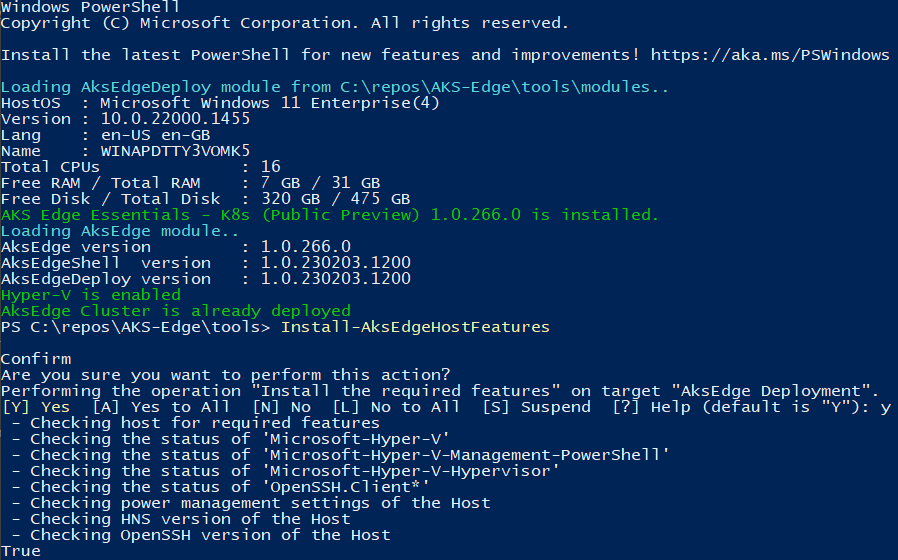
Above, we can see that I have already got all the pre-reqs configured correctly
At this point, I would also get the latest version of Helm (instructions taken from here)
#download helm from web
Invoke-WebRequest -Uri "https://get.helm.sh/helm-v3.6.3-windows-amd64.zip" -OutFile ".\helm-v3.6.3-windows-amd64.zip"
#Unzip to a local directory
Expand-Archive "helm-v3.6.3-windows-amd64.zip" C:\helm
#set helm in the env Path
$env:Path = "C:\helm\windows-amd64;$env:Path"
[Environment]::SetEnvironmentVariable('Path', $env:Path, 'Machine')
I ran the commands above from the AksEdgePrompt PowerShell session. I’ve added the path to the system environment variable (Machine) as I found that the path for Helm was not persistent across sessions when this was not specified.
Check the helm version

Helm version 3.6.3
create config file for scalable cluster
With the new version of the AKS Edge tool, the as previously mentioned, the JSON schema has been updated, so any previous config cannot be used. Here is the config I used to deploy a ‘scalable cluster’ (in my case, it is still a single machine cluster, but I can access the services running on it over my home network).
Whereas before, there were two config files, this has been collapsed into one.
The Arc section is used to register the cluster with Azure Arc and doesn’t need to be populated for the initial cluster deployment.
If you do want to populate the Arc section, you can obtain details such as SubscriptionID and TenantId using the following commands:
az login
#optional - run if you have multiple subscriptions and want to select which one to use
az account set --subscription '<name of the subscription>'

#SubscriptionId
az account show --query id -o tsv

#TenantId
az account show --query tenantId -o tsv
If you haven’t created an Azure AD Client App for use by Azure Arc for this cluster, then the official docs tell you to create one using the process here. That works, but you can use the updated AKS Edge tools to help create a more locked down assignment.
From the AKS-Edge repo, edit .\tools\scripts\AKSEdgeAzureSetup\AzureConfig.json
Fill in the details highlighted in the picture below.
From the AKS Edge prompt PowerShell window, change the directory to .\scripts\AKSEdgeAzureSetup and run:
.\AksEdgeAzureSetup.ps1 -jsonFile .\AzureConfig.json -spContributorRoleThis will:
Check if Azure CLI is installed (and install if not)
Check if the resource group exists - if not will create
Checks if Microsoft.HybridCompute provider registered - if not, will register
Checks if Microsoft.GuestConfiguration provider registered - if not, will register
Checks if Microsoft.HybridConnectivity provider registered - if not, will register
Checks if Microsoft.Kubernetes provider registered - if not, will register
Checks if Microsoft.KubernetesConfiguration provider registered - if not, will register
Checks if Microsoft.ExtendedLocation provider registered - if not, will register
Check if a Service Principal exists, if not, will create it (assuming you have permissions)
Populate the AzureConfig.json file with the
Arcconfiguration items.

You can now copy the Arc config items into the aksedge-config.json file. If the ”AksEdgeConfigFile”: “../../aksedge-config.json“ parameter is set, the script will populate the Arc parameters for you.
Using a similar procedure to create the aksedge-config.json per my previous post, use the following JSON document as a template:
{
    "SchemaVersion": "1.5",
    "Version": "1.0",
    "DeploymentType": "ScalableCluster",
    "Init": {
        "ServiceIPRangeSize": 10,
        "ServiceIPRangeStart": "<Free IpV4 address>"
    },
     "Arc": {
        "ClusterName": null,
        "Location": "uksouth",
        "ResourceGroupName": "rg-aks-edge-demo-uks",
        "SubscriptionId": "<Your Azure SubscriptionId>",
        "TenantId": "<Your Azure AD Tenant Id>",
        "ClientId": "<Azure AD App Client Id>",
        "ClientSecret": "<Azure AD App Client Secret>"
    },
    "Network": {
        "NetworkPlugin": "calico",
        "ControlPlaneEndpointIp": "<Free IpV4 address>",
        "Ip4GatewayAddress": "<IPv4 Gateway address>",
        "Ip4PrefixLength": 24,
        "DnsServers": [
            "<Your DNS Server e.g.:>8.8.8.8",
            "1.1.1.1"
        ]
        ,
        "InternetDisabled": false,
        "Proxy": {
            "Http": null,
            "Https": null,
            "No": null
        }
    },
    "User": {
        "AcceptEula": true,
        "AcceptOptionalTelemetry": false
    },
    "Machines": [
        {
            "NetworkConnection": {
                "AdapterName": "<Your Adapter Name for External Switch>",
                "Mtu": 0
              },
            "LinuxNode": {
                "CpuCount": 4,
                "MemoryInMB": 4096,
                "DataSizeInGB": 20,
                "Ip4Address": "<Free IP Address for the Linux host>"
            }
        }
    ]
}
With regards to the NetworkConnection section, you only have to provide the name of the network adapter that you have already created a vSwitch for, or that you want to automatically create. The default name of the vSwitch that is created is aksedgesw-ext
create config file for Single Machine cluster
Here’s the config file I used for the single machine cluster.
You can use the details here to get the Arc config settings
{
  "SchemaVersion": "1.5",
  "Version": "1.0",
  "DeploymentType": "SingleMachineCluster",
  "Init": {
    "ServiceIPRangeSize": 10
  },
  "Arc": {
    "ClusterName": null,
    "Location": null,
    "ResourceGroupName": null,
    "SubscriptionId": null,
    "TenantId": null,
    "ClientId": null,
    "ClientSecret": null
  },
  "Network": {
    "NetworkPlugin": "calico"
  },
  "User": {
    "AcceptEula": true,
    "AcceptOptionalTelemetry": false
  },
  "Machines": [
    {
      "LinuxNode": {
        "CpuCount": 4,
        "MemoryInMB": 4096,
        "DataSizeInGB": 10,
        "TimeoutSeconds": 300
      }
    }
  ]
}
Deploying the cluster
There’s no change from the previous version, so follow the instructions here.
Connectingthe cluster to Azure Arc
This process is simplified than previously documented in the previous blog post when I first looked at AKS-EE.
From the AKS Edge prompt PowerShell window, run the following:
# Connect Arc-enabled kubernetes
Connect-AksEdgeArc -JsonConfigFilePath .\aksedge-config.json
I have now done this a few of time, and I’ve found that the command can halt at the following step ( I left for longer than 10 minutes…):

If it does, I found closing the window, opening a fresh AKS Edge prompt PowerShell window and running the command again works.

And that’s it. I guess that with the AKS Edge tool now being v1, it’s pretty much GA release ready.

AKS Edge Essentials - diving deeper
I‘ve had the chance to use AKS Edge Essentials (AKS-EE) some more and I got to figure some more things out since my earlier article.
Whilst I ‘successfully’ deployed the cluster, it turn out that the configuration I had used meant that whilst I could deploy apps to the cluster, they couldn’t be accessed - therefore pretty pointless.
Looking further into this, the reason was I was using the aksedge-config.json file provided with the AKS Edge repo. That config file is geared towards multi-machine clusters, not single machines.
I managed to figure out two ways to fix the issue.
I had to uninstall and redeploy the cluster for both methods.
This a straightforward task, based on the official docs.
From the AKS Edge prompt PowerShell window:
# Disconnect cluster from Azure Arc
Disconnect-AideArcKubernetes

# Remove the cluster
Remove-AksEdgeDeployment -Force

There’s no need to uninstall the AKS Edge runtime.
Method 1
The most straightforward method is to create a config file with the minimum parameter set.
This will create a single machine cluster, using an internal vSwitch network, only accessible from the system you deploy it on..
Save the content below into a file in the tools directory. I called it
aksedge-singlemachine.json
{
  "SchemaVersion": "1.1",
  "Version": "1.0",
  "DeployOptions": {
      "ControlPlane": false,
      "Headless": false,
      "JoinCluster": false,
      "NetworkPlugin": "calico",
      "SingleMachineCluster": true,
      "TimeoutSeconds": 900,
      "NodeType": "Linux",
      "ServerTLSBootstrap": true
  },
  "EndUser": {
      "AcceptEula": false,
      "AcceptOptionalTelemetry": false
  },
  "LinuxVm": {
      "CpuCount": 4,
      "MemoryInMB": 4096,
      "DataSizeinGB": 30
  },
  "Network": {
      "ServiceIPRangeSize": 10
  }
}
2. Install the cluster per the instructions here (changing the -jsonconfigfilepath parameter)
New-AksEdgeDeployment -JsonConfigFilePath .\aksedge-singlemachine.jsonMethod 2
With this method, we aren’t deploying using the single machine config parameter. It will still be a single machine ‘cluster’, but will use an external vSwitch, so any app that is deployed can be access on the network, published from your machine.
First, we need to get some details of the network interface that will be used to create the external vSwitch. From the official documentation:
Run the following command to find the network adapters that are connected:
Get-NetAdapter -Physical | Where-Object { $_.Status -eq 'Up' }
Make a note of the name of either the Ethernet or WiFi adapter.
Next up, edit the aksedge-config.json file.
Edit ”SingleMachineCluster”: false, and populate the vSwitch parameters
Make sure the IP addresses, gateways and DNS servers match your network.
{
    "SchemaVersion": "1.1",
    "Version": "1.0",
    "DeployOptions": {
        "ControlPlane": false,
        "Headless": false,
        "JoinCluster": false,
        "NetworkPlugin": "calico",
        "SingleMachineCluster": false,
        "TimeoutSeconds": 900,
        "NodeType": "Linux",
        "ServerTLSBootstrap": true
    },
    "EndUser": {
        "AcceptEula": false,
        "AcceptOptionalTelemetry": false
    },
    "LinuxVm": {
        "CpuCount": 4,
        "MemoryInMB": 4096,
        "DataSizeinGB": 30,
        "Ip4Address": "<free ip on your network>"
    },
    "Network": {
        "VSwitch": {
            "Name": "aksee-ext",
            "Type": "External",
            "AdapterName": "<Ethernet Adapter Name>"
        },
        "ControlPlaneEndpointIp": "<free ip on your network>",
        "Ip4GatewayAddress": "<Gateway address>",
        "Ip4PrefixLength": 24,
        "ServiceIPRangeSize": 10,
        "ServiceIPRangeStart": "<start free ip on your network>",
        "ServiceIPRangeEnd": "<end free ip on your network>",
        "DnsServers": [
            "<DNS Server on your network>"
        ],
        "InternetDisabled": false,
        "Proxy": {
            "Http": "",
            "Https": "",
            "No": ""
        }
    }
}
With those changes in place, go ahead and deploy the cluster per the instructions here.

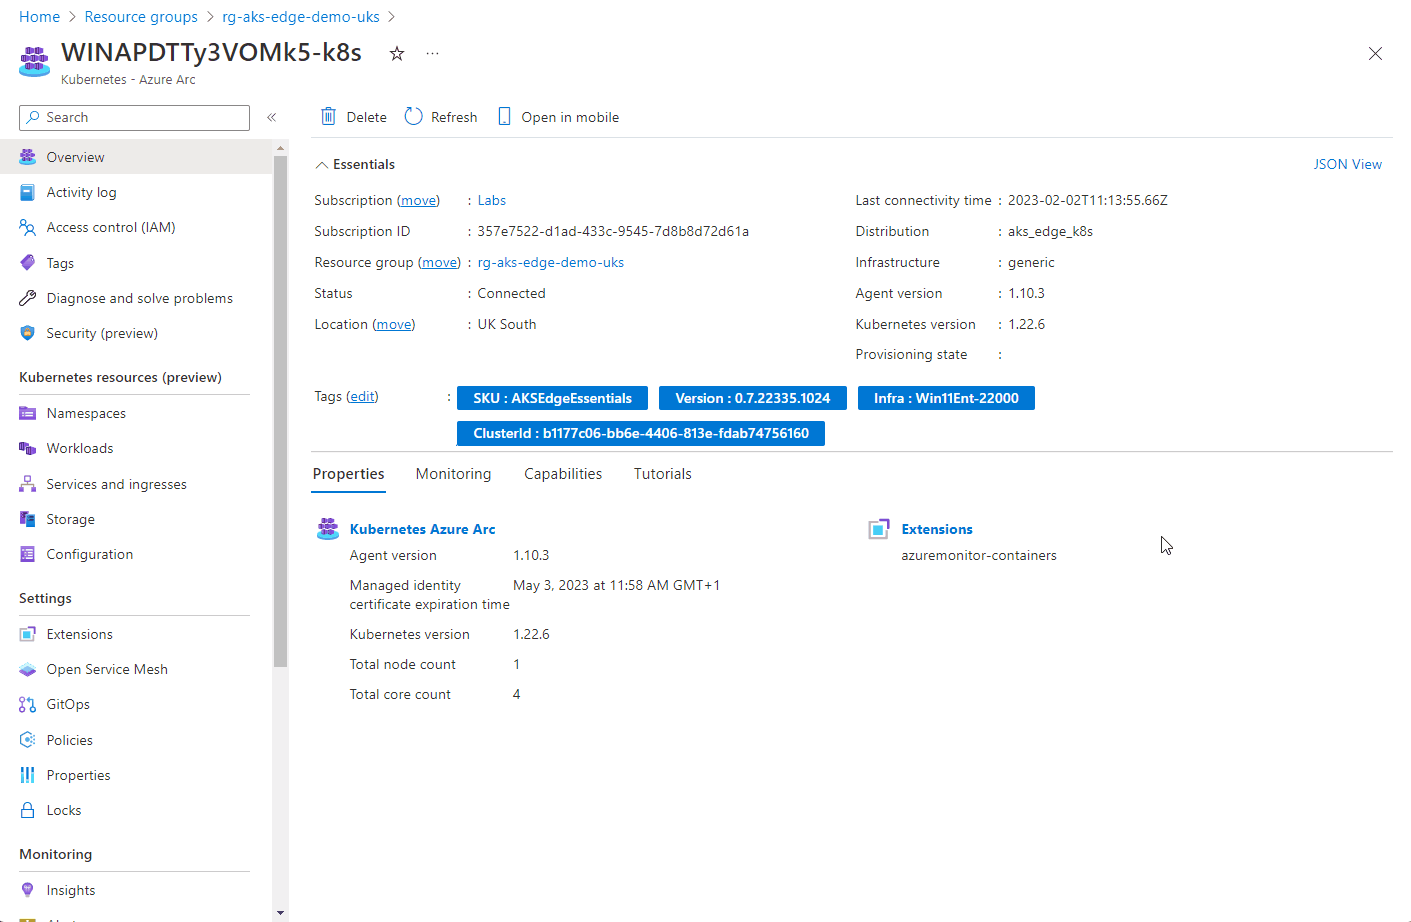
Once the cluster is deployed, continue to follow the instructions to connect the cluster to Azure Arc.
Deploying a test app
Now that I have a working cluster, I tested deploying the ‘Hello Arc’ app via GitOps.
Following the instructions for Remote deployment and CI with GitOps and Flux:
Fork the Azure Arc Apps repo:

(If you don’t want to fork your own repo, you can use mine: https://github.com/dmc-tech/azure-arc-jumpstart-apps)
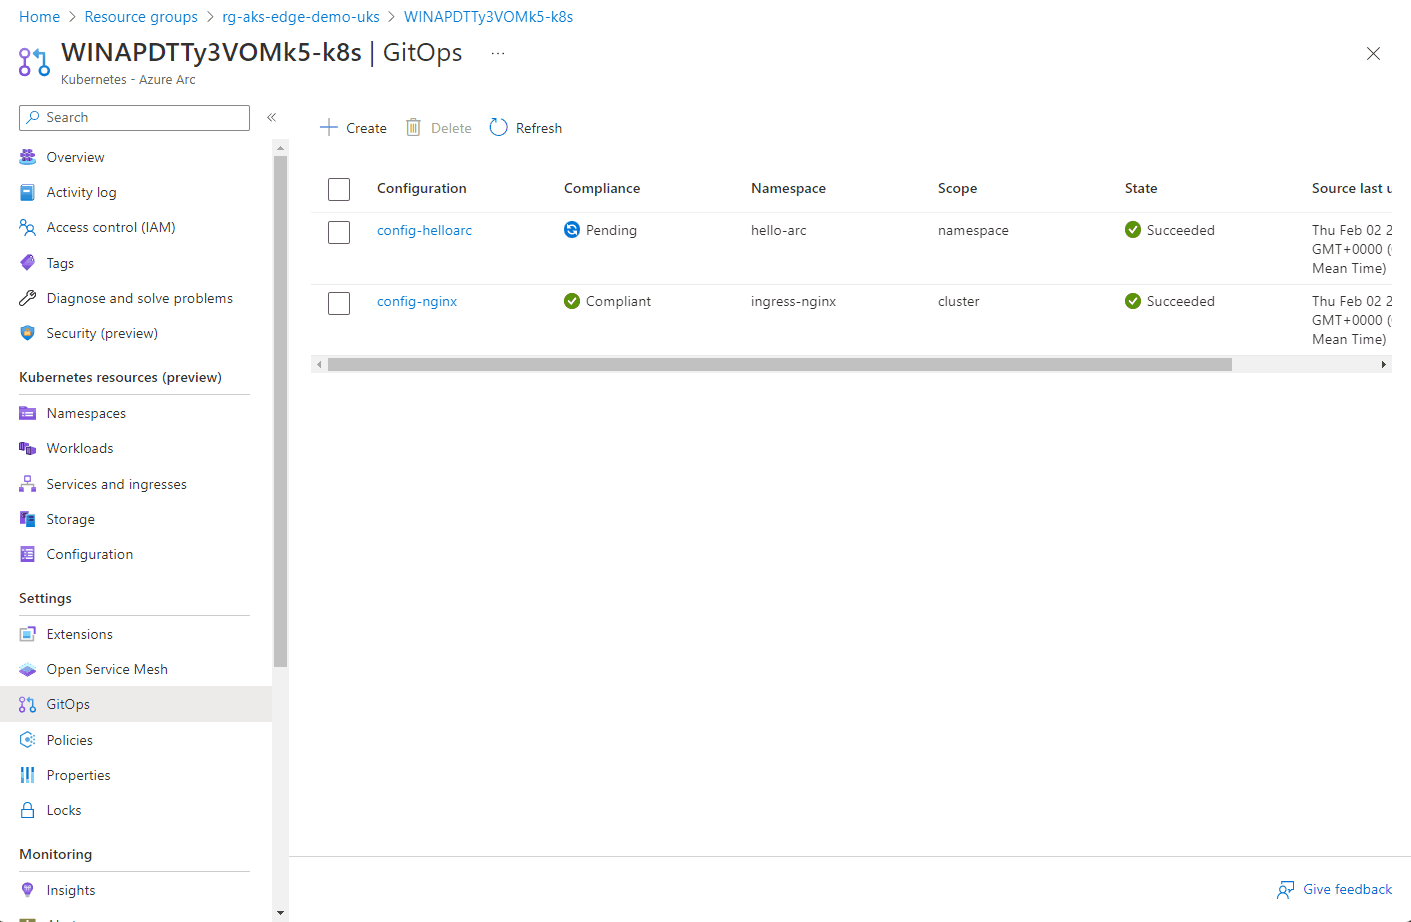
From the Azure portal, locate the resource group that the Azure Arc enabled Kubernetes cluster resource is located and open the GitOps blade.
First, create the nginx configuration.
You can follow the steps below:
Here you can see the configuration objects progress…

Once the config-nginx config has successfully deployed (it can take a few minutes), you can deploy the actual app.

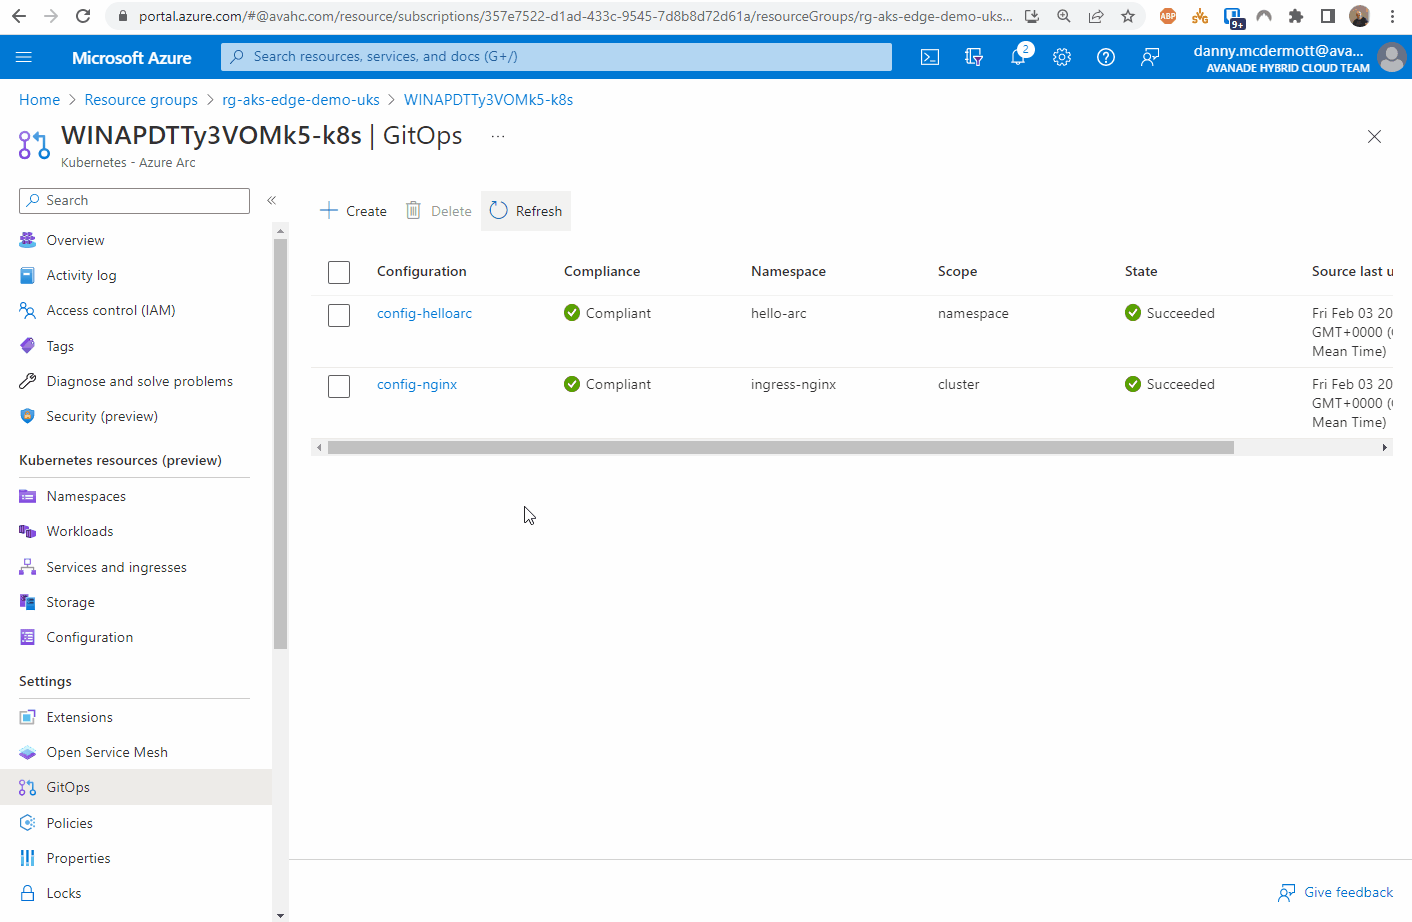
The progress of the configuration objects and the pod creation can be seen below via the Azure portal. Hopefully you can see the potential of the single pane of glass to manage multiple clusters from diverse locations.
Once the app has been deployed, it can be tested. I found the external IP address of the nginx instance by looking at the Services and ingresses of the cluster.
And there we have it.
I’m glad things didn’t work perfectly the first time as it allowed me to try some different things and understand what’s happening with the tool some more.
I would feel confident rolling this out to production scenarios since I’ve tried these different options.
Topic Search
Posts by Date
- August 2025 1
- March 2025 1
- February 2025 1
- October 2024 1
- August 2024 1
- July 2024 1
- October 2023 1
- September 2023 1
- August 2023 3
- July 2023 1
- June 2023 2
- May 2023 1
- February 2023 3
- January 2023 1
- December 2022 1
- November 2022 3
- October 2022 7
- September 2022 2
- August 2022 4
- July 2022 1
- February 2022 2
- January 2022 1
- October 2021 1
- June 2021 2
- February 2021 1
- December 2020 2
- November 2020 2
- October 2020 1
- September 2020 1
- August 2020 1
- June 2020 1
- May 2020 2
- March 2020 1
- January 2020 2
- December 2019 2
- November 2019 1
- October 2019 7
- June 2019 2
- March 2019 2
- February 2019 1
- December 2018 3
- November 2018 1
- October 2018 4
- September 2018 6
- August 2018 1
- June 2018 1
- April 2018 2
- March 2018 1
- February 2018 3
- January 2018 2
- August 2017 5
- June 2017 2
- May 2017 3
- March 2017 4
- February 2017 4
- December 2016 1
- November 2016 3
- October 2016 3
- September 2016 5
- August 2016 11
- July 2016 13